Tutorial: The Breakeven Analysis
Tutorial: The Breakeven Analysis. Michael Bokor. Order of the Slides. Define Breakeven Analysis Theory behind it What it can be used for Breakeven formula Example Problem Conclusion Reference page. What is a break-even analysis?.

Tutorial: The Breakeven Analysis
E N D
Presentation Transcript
Tutorial: The Breakeven Analysis Michael Bokor
Order of the Slides • Define Breakeven Analysis • Theory behind it • What it can be used for • Breakeven formula • Example • Problem • Conclusion • Reference page
What is a break-even analysis? • Breakeven Analysis- A decision-making aid that enables a manager to determine whether a particular volume of sales will result in losses or profits
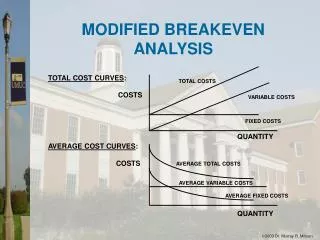
The theory behind the breakeven analysis • Made up of four basic concepts • Fixed costs- costs that do not change • Variable costs- costs that rise in propitiation to sales • Revenue- the total income received • Profit- the money you have after subtracting fixed and variable cost from revenue
What can it be used for? • Monthly expenses- use it to see if your income is more then your expenses • Determine minimum price product can be sold for • Determine optimum price product can be sold for • Calculate effects of marketing programs on price
Breakeven formula • P(X) = f + V(X) • F = fixed costs • V = variable costs per unit • X = volume of output (in units) • P = price per unit
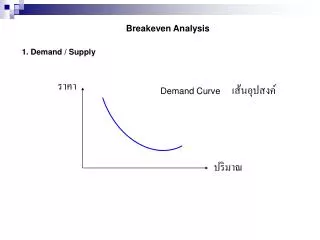
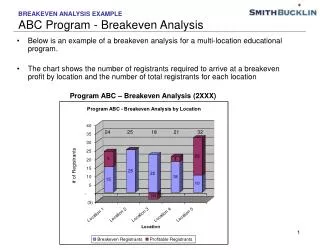
This chart shows that the breakeven point is where the income and costs are equal
Breakeven formula cont. • If we rearrange the where the breakeven is X then the formula look like this. X = F /( P – V) • This formula says that the breakeven point is where the number of sales needed to make the cost equal to the revenue.
Example Lets say you own a business selling burgers It costs $1.00 to make one burger That’s your V or Variable cost You sell each burger for $2.80 That’s your P or price per unit Your cost for rent, utilities, overhead, etc... is $100,000 per month That's your F or fixed cost
Example cont. V = $1.00 P = $2.80 F = $100,000 X = F /( P – V) X = 100,000 / ( 2.80 - 1 ) X = 100,000 / ( 1.80 ) X = 55,555 To breakeven you would need to sell 55,555 burgers
Problem Try out this problem for your self • You own a lemonade stand • It costs you $0.05 to make cup of lemonade • You sell your lemonade for $0.25 • It cost you $50.00 to make the stand • How many cups of lemonade do you have to sell to breakeven? Solve now
Answer X = F /( P – V) X = 50 / ( .25 - .05 ) X = 50/ ( .20 ) X =250 You would need to sell 250 cups of lemonade to breakeven.
Conclusion • A Breakeven Analysis is a simple tool to use to determine if you have priced your product correctly • A Breakeven Analysis helps you calculate how much you need to sell before you begin to make a profit. You can also see how fixed costs, price, volume, and other factors affect your net profit.
Reference page • A Framework for Management –Gary Dessler • http://www.tutor2u.net/business/production/break_even.htm 3/1/06 • http://connection.cwru.edu/mbac424/breakeven/BreakEven.html 3/1/06 • http://www.dinkytown.net/java/BreakEven.html 3/1/06 • http://office.microsoft.com/en-us/templates/TC011165121033.aspx 3/1/06