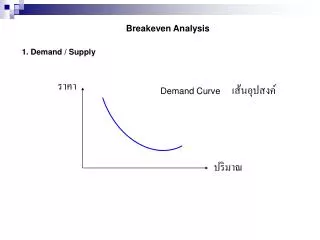
Breakeven Analysis
Breakeven Analysis. Improving Productivity. Break-Even Analysis. Break-even analysis has TWO forms: A. CVP (cost-volume-profit): to determine the volume of sales at which a specific product will generate 0 profit Total Costs = Revenue, i.e. Revenue – Total Costs = 0

Breakeven Analysis
E N D
Presentation Transcript
Breakeven Analysis Improving Productivity
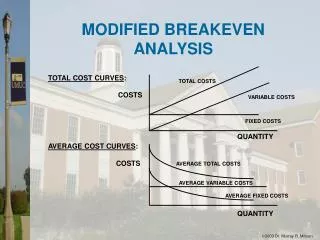
Break-Even Analysis • Break-even analysis has TWO forms: • A. CVP (cost-volume-profit): to determine the volume of sales at which a specific product will generate 0 profit • Total Costs = Revenue, i.e. Revenue – Total Costs = 0 • B. to compare processes by finding the volume at which two different processes have equal total costs. • Total costs of process X = Total costs of process Y • Variable costs (c) are costs that vary directly with the volume of output. • Fixed costs (F) are those costs that remain constant with changes in output level.
BREAKEVEN :Two Processes or Make-or-Buy Decisions • Choose between two processes or between an internal process and buying those services or materials. • The solution finds the point at which the total costs of each of the two alternatives are equal. • Total costs of Alt. 1 = Total costs of Alt. 2 • F1 + c1Q = F2 + c2Q • The forecast volume is then applied to see which alternative has the lowest cost for that volume. • Determining the Breakeven Quantity, Q* • F1 + c1Q = F2 + c2Q • c1Q – c2Q = F2 – F1 • Q(c1 – c2) = F2 – F1 • Q* = (F2 – F1) / (c1 – c2)
Make or BuyBreakeven Example • Analyzing a production process that needs improvement, producing a metal flange. • Two Alternatives: • Make: buy a new machine and run the process in house • Buy: contract with an outside vendor who makes the part • Costs of each alternative: • Make: • Fixed costs: New machine, investment cost = $12,000/yr, Fm • Variable costs: $1.50 / piece, (material & labor), cm • Buy: • Fixed costs: annual tooling costs = $2,400, Fb • Variable costs: $2.00/ piece, cb
Example: MAKE v. BUY, Analyzing a production process that needs improvement, producing a metal flange. Two Alternatives: Make: buy a new machine and run the process in house Buy: contract with an outside vendor who makes the part RESULTS The Breakeven Volume is 19,200. If the volume is more than 19,200, then MAKE is the better than BUY. But if the Volume is less than the Breakeven, then BUY is better. Since the estimated annual volume is 25,000, MAKE is the choice. Costs of each alternative: Make: Fixed costs: New machine, investment cost = $12,000/yr, Fm Variable costs: $1.50 / piece, (material & labor), cm Buy: Fixed costs: annual tooling costs = $2,400, Fb Variable costs: $2.00/ piece, cb View this example in the Excel file: BreakevenCalc
Make or BuyBreakeven Example Algebraic Solution: • Q* = (Fm – Fb) / (cb – cm) • Q* = (12,000 – 2,400) / (2.00 – 1.50) • Q* = 9600 / 0.50 • Q* = 19,200 Breakeven Annual Volume • If the forecast or expected volume is more than Breakeven (19,200), then the MAKE alternative generates the lowest Total Costs, and vice versa. • Since the forecast volume is 25,000, the choice is to MAKE, so you should buy the machine and get started.
Example 2Two Processes • A new machine is needed for a process that produces a gear: • Alt. 1: Machine A • Fixed Costs: • Annualize Investment: $120,000 • Annual Maintenance: $20,000 • Variable costs: • Material: $2.25 / gear • Labor: $6.25 / gear • Alt. 2: Machine B (faster and more efficient in terms of labor • Fixed Costs: • Annualize Investment: $165,000 • Annual Maintenance: $35,000 • Variable costs: • Material: $2.25 / gear • Labor: $2.25 / gear Try to solve this example: First try the formula; Then use the BreakevenCalc Excel spreadsheet.
CVP Break-Even Analysis • Notation: • Q is the volume of customers or units, • c is the unit variable cost, • F is fixed costs and • p is the revenue per unit • cQ = the total variable cost. • Total cost =F + cQ • Total revenue =pQ • Profit = Revenue – Total Costs • Breakeven Profit = 0 • pQ = F + cQ(Total revenue = Total cost) Determining the Breakeven Quantity, Q* pQ = F + cQ pQ – cQ = F Q(p - c) = F Q* = F / (p – c)
Break-Even Analysis can tell you… • If a forecast sales volume is sufficient to break even (no profit or no loss) • How low variable cost per unit must be to break even given current prices and sales forecast. • How low the fixed cost need to be to break even. • How price levels affect the break-even volume.
Hospital Example A hospital is considering a new procedure to be offered at $200 per patient. The fixed cost per year would be $100,000, with total variable costs of $100 per patient. What is the break-even quantity for this service? = 1,000 patients Q = F / (p - c) = 100,000 / (200-100)
Quantity Total Annual Total Annual (patients) Cost ($) Revenue ($) (Q) (100,000 + 100Q) (200Q) 0 100,000 0 2000 300,000 400,000 Dollars (in thousands) | | | | 500 1000 1500 2000 Patients (Q) 400 – 300 – 200 – 100 – 0 – Hospital Example, continued
Quantity Total Annual Total Annual (patients) Cost ($) Revenue ($) (Q) (100,000 + 100Q) (200Q) Quantity Total Annual Total Annual (patients) Cost ($) Revenue ($) (Q) (100,000 + 100Q) (200Q) (2000, 400) 0 100,000 0 2000 300,000 400,000 0 100,000 0 2000 300,000 400,000 Dollars (in thousands) | | | | 500 1000 1500 2000 Patients (Q) 400 – 300 – 200 – 100 – 0 – Total annual revenues
Quantity Total AnnualTotal Annual (patients) Cost ($)Revenue ($) (Q) (100,000 + 100Q)(200Q) 400 – 300 – 200 – 100 – 0 – (2000, 400) 0 100,0000 2000 300,000400,000 (2000, 300) Total annual costs Dollars (in thousands) Fixed costs | | | | 500 1000 1500 2000 Patients (Q) Total annual revenues
Quantity Total AnnualTotal Annual (patients) Cost ($)Revenue ($) (Q) (100,000 + 100Q)(200Q) 400 – 300 – 200 – 100 – 0 – (2000, 400) 0 100,0000 2000 300,000400,000 Profits Total annual revenues (2000, 300) Total annual costs Dollars (in thousands) Break-even quantity Fixed costs Loss | | | | 500 1000 1500 2000 Patients (Q)
400 – 300 – 200 – 100 – 0 – pQ – (F + cQ) 200(1500) – [100,000 + 100(1500)] $50,000 Profits Total annual revenues Total annual costs Dollars (in thousands) Forecast = 1,500 Fixed costs Loss | | | | 500 1000 1500 2000 Patients (Q) Sensitivity AnalysisExample A.2
Example, Denver Zoo What are: p? F? c?
Denver ZooSetting up the Solution Q TR = pQ TC = F + cQ
Denver ZooGraphical Solution Q TR = pQ TC = F + cQ
Denver ZooAlgebraic Solution pQ = F + cQ Q TR = pQ TC = F + pQ