Online Resource 2
Plant Molecular Biology Reporter The OsGEX2 gene promoter confers pollen sperm cell-specific expression in transgenic rice. Meridith Cook and Roger Thilmony* USDA-ARS, Western Regional Research Center, Crop Improvement and Utilization Research Unit, 800 Buchanan Street, Albany, CA 94710 USA

Online Resource 2
E N D
Presentation Transcript
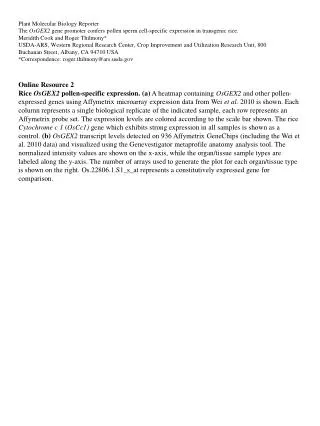
Plant Molecular Biology Reporter The OsGEX2 gene promoter confers pollen sperm cell-specific expression in transgenic rice. Meridith Cook and Roger Thilmony* USDA-ARS, Western Regional Research Center, Crop Improvement and Utilization Research Unit, 800 Buchanan Street, Albany, CA 94710 USA *Correspondence: roger.thilmony@ars.usda.gov Online Resource 2 Rice OsGEX2 pollen-specific expression.(a) A heatmap containing OsGEX2 and other pollen-expressed genes using Affymetrix microarray expression data from Wei et al. 2010 is shown. Each column represents a single biological replicate of the indicated sample, each row represents an Affymetrix probe set. The expression levels are colored according to the scale bar shown. The rice Cytochrome c 1 (OsCc1) gene which exhibits strong expression in all samples is shown as a control. (b)OsGEX2 transcript levels detected on 936 Affymetrix GeneChips (including the Wei et al. 2010 data) and visualized using the Genevestigator metaprofile anatomy analysis tool. The normalized intensity values are shown on the x-axis, while the organ/tissue sample types are labeled along the y-axis. The number of arrays used to generate the plot for each organ/tissue type is shown on the right. Os.22806.1.S1_s_at represents a constitutively expressed gene for comparison.
a microarray normalized intensity Affymetrix ID Annotation OsGEX2 gamete expressed 2 OsAffx.17894.1.S1_at Os.41333.1.A1_at OsGEX3 gamete expressed 3 Os.54874.1.S1_at OsGEX1 gamete expressed 1 OsNOP no pollen C2 & GRAM OsAffx.5167.1.S1_x_at OsIPK Ca-dependent kinase Os.22582.1.S1_at OsSCP1 cystein rich protein Os.12270.1.S1_at Ory s 1 major pollen allergen Os.2402.1.S1_at OsIPA pollen allergen/expansin Os.12697.1.S1_at Os.2370.1.S1_at OsUGP2 UDP-gluc phosphoryl. Os.46385.1.A1_at TIP4.1 aquaporin Os.8064.1.S1_at pectinacetylesterase Os.46452.2.S1_x_at proline-rich APG protein Os.52857.1.S1_at ribonucleoprotein Os.10312.1.S1_at OsCc1 cytochrome c b Online Resource 2