Multivariate Genetic Analysis
690 likes | 756 Vues
Learn how to examine genetic and environmental factors that affect trait correlations using twin data in this introductory guide.

Multivariate Genetic Analysis
E N D
Presentation Transcript
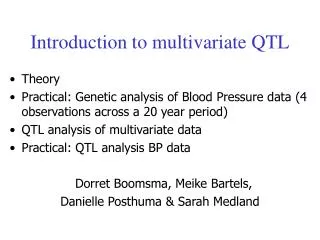
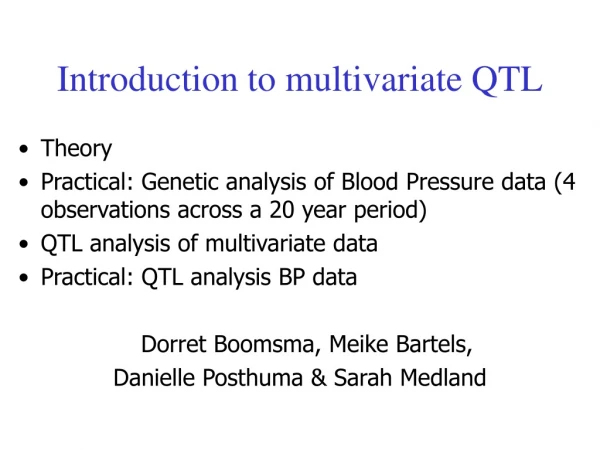
Introduction to Multivariate Genetic Analysis Meike Bartels, Hermine Maes, Elizabeth Prom-Wormley and Michel Nivard
Aim and Rationale Aim: to examine the source of factors that make traits correlate or co-vary Rationale: Traits may be correlated due to shared genetic factors (A) or shared environmental factors (C or E) Can use information on multiple traits from twin pairs to partition covariation into genetic and environmental components
Example 1 Why do traits correlate/covary? How can we explain the association? Additive genetic factors (rG) Shared environment (rC) Non-shared environment (rE) rG rC 1 1 1 1 A1 A2 C2 C1 A112 C112 A222 C222 ADHD IQ E112 E222 1 1 E1 E2 rE
Example 2 • Associations between phenotypes over time • Does anxiety in childhood lead to depression in adolescence? • How can we explain the association? • Additive genetic factors (a21) • Shared environment (c21) • Non-shared environment (e21) • How much is not explained by prior anxiety? 1 1 1 1 C1 C2 A1 A2 c21 c11 c22 a11 a21 a22 Adolescent depression Childhood anxiety e11 e21 e22 1 1 E1 E2
Sources of Information • For example: two traits measured in twin pairs • Interested in: • Cross-trait covariance within individuals • Cross-trait covariance between twins • MZ:DZ ratio of cross-trait covariance between twins
Observed Covariance Matrix Twin 1 Twin 2 Twin 1 Twin 2
Observed Covariance Matrix Twin 1 Twin 2 Within-twin covariance Twin 1 Within-twin covariance Twin 2
Observed Covariance Matrix Twin 1 Twin 2 Within-twin covariance Twin 1 Cross-twin covariance Within-twin covariance Twin 2
SEM: Cholesky Decomposition 1 1 1 1 C1 C2 A1 A2 c11 c22 a11 a22 Twin 1 Phenotype 2 Twin 1 Phenotype 1 e11 e22 1 1 E1 E2
SEM: Cholesky Decomposition 1 1 1 1 C1 C2 A1 A2 c21 c11 c22 a11 a21 a22 Twin 1 Phenotype 2 Twin 1 Phenotype 1 e11 e21 e22 1 1 E1 E2
SEM: Cholesky Decomposition 1/0.5 1/0.5 1 1 1 1 1 1 1 1 1 1 C1 C2 C1 C2 A1 A2 A1 A2 c21 c21 c11 c22 a11 a21 a22 c11 c22 a11 a21 a22 Twin 2 Phenotype 2 Twin 1 Phenotype 2 Twin 2 Phenotype 1 Twin 1 Phenotype 1 e11 e21 e22 e11 e21 e22 1 1 1 1 E1 E2 E1 E2
Cholesky Decomposition Path Tracing
Within-Twin Covariances (A) 1 1 A1 A2 a11 a21 a22 Twin 1 Phenotype 2 Twin 1 Phenotype 1 Twin 1 Twin 1
Within-Twin Covariances (A) 1 1 A1 A2 a11 a21 a22 Twin 1 Phenotype 2 Twin 1 Phenotype 1 Twin 1 Twin 1
Within-Twin Covariances (A) 1 1 A1 A2 a11 a21 a22 Twin 1 Phenotype 2 Twin 1 Phenotype 1 Twin 1 Twin 1
Within-Twin Covariances (A) 1 1 A1 A2 a11 a21 a22 Twin 1 Phenotype 2 Twin 1 Phenotype 1 Twin 1 Twin 1
Within-Twin Covariances (C) 1 1 C1 C2 c11 c21 c22 Twin 1 Phenotype 2 Twin 1 Phenotype 1 Twin 1 Twin 1
Within-Twin Covariances (E) Twin 1 Phenotype 2 Twin 1 Phenotype 1 e11 e21 e22 1 1 E1 E2 Twin 1 Twin 1
Cross-Twin Covariances (A) 1/0.5 1/0.5 1 1 1 1 A1 A2 A1 A2 a11 a21 a22 a11 a21 a22 Twin 2 Phenotype 2 Twin 1 Phenotype 2 Twin 2 Phenotype 1 Twin 1 Phenotype 1 Twin 1 Twin 2
Cross-Twin Covariances (A) 1/0.5 1/0.5 1 1 1 1 A1 A2 A1 A2 a11 a21 a22 a11 a21 a22 Twin 2 Phenotype 2 Twin 1 Phenotype 2 Twin 2 Phenotype 1 Twin 1 Phenotype 1 Twin 1 Twin 2
Cross-Twin Covariances (A) 1/0.5 1/0.5 1 1 1 1 A1 A2 A1 A2 a11 a21 a22 a11 a21 a22 Twin 2 Phenotype 2 Twin 1 Phenotype 2 Twin 2 Phenotype 1 Twin 1 Phenotype 1 Twin 1 Twin 2
Cross-Twin Covariances (A) 1/0.5 1/0.5 1 1 1 1 A1 A2 A1 A2 a11 a21 a22 a11 a21 a22 Twin 2 Phenotype 2 Twin 1 Phenotype 2 Twin 2 Phenotype 1 Twin 1 Phenotype 1 Twin 1 Twin 2
Cross-Twin Covariances (C) 1 1 1 1 1 1 C1 C2 C1 C2 c21 c21 c11 c22 c11 c22 Twin 2 Phenotype 2 Twin 1 Phenotype 2 Twin 2 Phenotype 1 Twin 1 Phenotype 1 Twin 1 Twin 2
Predicted Model Twin 1 Twin 2 Within-twin covariance Twin 1 Cross-twin covariance Within-twin covariance Twin 2
Predicted Model Twin 1 Twin 2 Within-twin covariance Twin 1 Cross-twin covariance Within-twin covariance Twin 2
Predicted Model Twin 1 Twin 2 Within-twin covariance Variance of P1 and P2 the same across twins and zygosity groups Twin 1 Cross-twin covariance Within-twin covariance Twin 2
Predicted Model Twin 1 Twin 2 Within-twin covariance Covariance of P1 and P2 the same across twins and zygosity groups Twin 1 Cross-twin covariance Within-twin covariance Twin 2
Predicted Model Twin 1 Twin 2 Within-twin covariance Cross-twin covariance within each trait differs by zygosity Twin 1 Cross-twin covariance Within-twin covariance Twin 2
Predicted Model Twin 1 Twin 2 Within-twin covariance Cross-twin cross-trait covariance differs by zygosity Twin 1 Cross-twin covariance Within-twin covariance Twin 2
Example Covariance Matrix MZ Twin 1 Twin 2 Within-twin covariance Twin 1 Cross-twin covariance Within-twin covariance Twin 2 Twin 1 Twin 2 DZ Within-twin covariance Twin 1 Within-twin covariance Cross-twin covariance Twin 2
Example Covariance Matrix MZ Twin 1 Twin 2 Within-twin covariance Twin 1 Cross-twin covariance Within-twin covariance Twin 2 Twin 1 Twin 2 DZ Within-twin covariance Twin 1 Within-twin covariance Cross-twin covariance Twin 2
Example Covariance Matrix MZ Twin 1 Twin 2 Within-twin covariance Twin 1 Cross-twin covariance Within-twin covariance Twin 2 Twin 1 Twin 2 DZ Within-twin covariance Twin 1 Within-twin covariance Cross-twin covariance Twin 2
Summary • Within-individual cross-trait covariance implies common aetiological influences • Cross-twin cross-trait covariance implies common aetiological influences are familial • Whether familial influences genetic or environmental shown by MZ:DZ ratio of cross-twin cross-trait covariances
Cholesky Decomposition Bivariate Genetic analyses Specification in OpenMx
Within-Twin Covariance Path Tracing: 1 1 A1 A2 a11 a21 a22 P1 P2
Within-Twin Covariance Path Tracing: 1 1 A1 A2 a11 a21 a22 a Lower 2 x 2: a1 a2 P1 P2 P1 P2
Within-Twin Covariance Path Tracing: 1 1 A1 A2 a11 a11 a21 a21 a22 a22 a Lower 2 x 2: a1 a2 P1 P2 P1 P2
Within-Twin Covariance OpenMx nv <- 2 .. mxMatrix ( type="Lower", nrow=nv, ncol=nv, free=TRUE, values=.6, name="a" ), mxAlgebra( expression=a %*% t(a), name="A" ),
Total Within-Twin Covar. Using matrix addition, the total within-twin covariance for the phenotypes is defined as:
OpenMx Matrices & Algebra OpenMx multACEModel <- mxModel(”multACE", mxModel("ACE", # Matrices a, c, and e to store a, c, and e path coefficients mxMatrix( type="Lower", nrow=nv, ncol=nv, free=TRUE, values=.6, name="a" ), mxMatrix( type="Lower", nrow=nv, ncol=nv, free=TRUE, values=.6, name="c" ), mxMatrix( type="Lower", nrow=nv, ncol=nv, free=TRUE, values=.6, name="e" ), # Matrices A, C, and E compute variance componentsmxAlgebra( expression=a %*% t(a), name="A" ), mxAlgebra( expression=c %*% t(c), name="C" ), mxAlgebra( expression=e %*% t(e), name="E" ), # Algebra to compute total variances and standard deviations (diagonal only)mxAlgebra( expression=A+C+E, name="V" ), mxMatrix( type="Iden", nrow=nv, ncol=nv, name="I"), mxAlgebra( expression=solve(sqrt(I*V)), name="isd"),
Additive Genetic Cross-Twin Covariance (DZ) 0.5 0.5 Path Tracing: Within-traits P11-P12 = 0.5a112 P21-P22 = 0.5a222+0.5a212 Cross-traits P11-P22 = 0.5a11a21 P21-P12 = 0.5a21a11 1 1 1 1 A1 A2 A1 A2 a11 a21 a22 a11 a21 a22 P22 P11 P21 P12 Twin 1 Twin 2
Additive Genetic Cross-Twin Covariance (MZ) 1 1 1 1 1 1 A1 A2 A1 A2 a11 a21 a22 a11 a21 a22 P22 P11 P21 P12 Twin 1 Twin 2
Common Environment Cross-Twin Covariance 1 1 1 1 1 1 C1 C2 C1 C2 c11 c21 c22 c11 c21 c22 P22 P11 P21 P12 Twin 1 Twin 2
Covariance Model for Twin Pairs OpenMx # Algebra for expected variance/covariance matrix in MZmxAlgebra( expression= rbind ( cbind(A+C+E , A+C), cbind(A+C , A+C+E)), name="expCovMZ" ), # Algebra for expected variance/covariance matrix in DZ, note use of 0.5, converted to 1*1 matrix mxAlgebra( expression= rbind ( cbind(A+C+E , 0.5%x%A+C), cbind(0.5%x%A+C , A+C+E)), name="expCovDZ" ) ),
Three Important Results Variance Decomposition -> Heritability, (Shared) environmental influences Covariance Decomposition -> The influences of genes and environment on the covariance between the two variables “how much of the phenotypic correlation is accounted for by genetic and environmental influences” Genetic and Environmental correlations -> the overlap in genes and environmental effects “is there a large overlap in gene/ environmental sets”
OpenMx Output Variance Decomposition -> Heritability, (Shared) environmental influences Covariance Decomposition -> The influences of genes and environment on the covariance between the two variables [1] "Matrix A/V" stCovA1 stCovA2 family 0.4809 0.7154 happy 0.7154 0.3995 [1] "Matrix C/V" stCovC1 stCovC2 family 0.0919 0.1121 happy 0.1121 0.0250 [1] "Matrix E/V" stCovE1 stCovE2 family 0.4272 0.1725 happy 0.1725 0.5755
1/.5 1/.5 A1 A2 A1 A2 a11 a21 a22 a11 a21 a22 P11 P21 P12 P22 Twin 1 Twin 2 Genetic correlation
OpenMx Output [1] "Matrix solve(sqrt(I*A)) %&% A" corA1 corA2 family 1.0000 0.6985 happy 0.6985 1.0000 [1] "Matrix solve(sqrt(I*C)) %&% C" corC1 corC2 family 1.0000 1.0000 happy 1.0000 1.0000 [1] "Matrix solve(sqrt(I*E)) %&% E" corE1 corE2 family 1.0000 0.1488 happy 0.1488 1.0000
If the rg = 1, the two sets of genes overlap completely rg If however a11 and a22 are near to zero, genes do not contribute to the observed correlation Genetic correlation & contribution to observed correlation A1 A2 a11 a22 P11 P21 Twin 1