Download
1 / 56
570 likes | 671 Vues
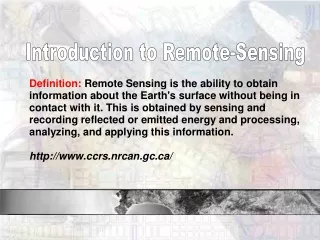
Learn about the operation and characteristics of cross-track and pushbroom multispectral scanning systems for Earth remote sensing from space. Detailed insights on various optical systems and instruments like MODIS and MISR are provided in the slides by Michael King and Compton Tucker. Explore the applications and advantages of these technologies for studying land surfaces, atmospheric conditions, and more.

E N D
Geography 372Introduction to Remote Sensing Slides from Michael King EOS Senior Project Scientist http://terra.nasa.gov/
Introduction to multispectral remote sensing Slides from: Compton Tucker & Michael D. King Outline • Description of numerous kinds of optical systems for the remote sensing of the Earth from space • Cross-track (whiskbroom) scanning systems • Pushbroom scanning systems • Airborne and spaceborne multispectral whiskbroom and pushbroom scanners • MODIS, ETM+ (whiskbroom) • MISR, AirMISR (pushbroom) • Geometric characteristics of cross-track scanners • Hyperspectral scanners • Spectral reflectance of various land ecosystems and surfaces
Cross-track, or Whiskbroom, Multispectral Scanner System Operation
Instantaneous Field of View and Resulting Ground Area Sensed Directly Beneath an Aircraft by a Multi-spectral Scanner = ifov (solid angle)
Instantaneous Field of View and Resulting Ground Area Sensed Directly Beneath an Aircraft by a Multi-spectral Scanner = scan angle
Terra & Aqua • http://terra.nasa.gov/ • 5 instruments • ASTER • CERES • MISR • MODIS • MOPITT
ASTER • The Advanced Spaceborne Thermal Emission and Reflection Radiometer obtains high-resolution (15 to 90 square meters per pixel) images of the Earth in 14 different wavelengths (Bands) of the electromagnetic spectrum, ranging from visible to thermal infrared light. • Scientists use ASTER data to create detailed maps of land surface temperature, emissivity, reflectance, and elevation. • ASTER is the only high spatial resolution instrument on the Terra platform. ASTER's ability to serve as a 'zoom' lens for the other Terra instruments is particularly important for change detection, calibration/validation and land surface studies
MODerate-resolution Imaging Spectroradiometer (MODIS) • NASA, Terra & Aqua • launches 1999, 2001 • 705 km polar orbits, descending (10:30 a.m.) & ascending (1:30 p.m.) • Sensor Characteristics • 36 spectral bands (490 detectors) ranging from 0.41 to 14.39 µm • Two-sided paddle wheel scan mirror with 2330 km swath width • Spatial resolutions: • 250 m (bands 1 - 2) • 500 m (bands 3 - 7) • 1000 m (bands 8 - 36) • 2% reflectance calibration accuracy • onboard solar diffuser & solar diffuser stability monitor • 12 bit dynamic range (0-4095)
MODIS Onboard Calibrators Spectral Radiometric Calibration Assembly Solar Diffuser Blackbody Scan Mirror Space View Port Fold Mirror Nadir (+z)
MODIS Optical System Visible Focal Plane SWIR/MWIR Focal Plane Scan Track NIR Focal Plane LWIR Focal Plane
9/17/2006 Northern California Fires
MODIS Applications • Pg 243 of Text • Band 1 & 2 Land cover classification, chlorophyll absorption • Bands 3 - 7 Land, cloud & aerosol mapping • Bands 8 - 16 Ocean color, phytoplankton, biogeochemistry • Bands 17 - 19 Atmospheric water vapor • Bands 20-23 Surface-cloud temperature • Bands 24 & 25 Atmospheric temperature • Band 26 Cirrus Clouds • Bands 27 - 29 Water vapor • Bands 30 Ozone • Bands 31 & 32 Suface-cloud temperature • Bands 33 – 36 Cloud-top altitude
NASA, EOS Terra Launched in 1999 polar, descending orbits of 705 km, 10:30 a.m. crossing Sensor Characteristics uses nine CCD-based push-broom cameras viewing nadir and fore & aft to 70.5° four spectral bands for each camera (36 channels), at 446, 558, 672, & 866 nm resolutions of 275 m, 550 m, or 1.1 km Advantages high spectral stability 9 viewing angles helps determine aerosol by µ dependence (fixed t) Multi-angle Imaging SpectroRadiometer (MISR)
Orbital characteristics 400 km swath 9 day global coverage 7 min to observe each scene at all 9 look angles MISR Pushbroom Scanner • Family portrait • 9 MISR cameras • 1 AirMISR camera
MISR Provides New Angle on Haze • In this MISR view spanning from Lake Ontario to Georgia, the increasingly oblique view angles reveal a pall of haze over the Appalachian Mountains
MISR Provides New Angle on Haze • In this MISR view spanning from Lake Ontario to Georgia, the increasingly oblique view angles reveal a pall of haze over the Appalachian Mountains
AirMISR AirMISR Instrument in the Nose of the NASA ER-2 Aircraft
MISR & AirMISR Simultaneously View South African Fires • In the MISR view on the left, the 45 aft view was used to image the Drakensberg Mountains (lower left), burn scars, and fires in South Africa (image 85 km x 200 km) • In the AirMISR view on the right, acquired nearly simultaneously from the NASA ER-2 aircraft as part of SAFARI 2000, the nadir view was used (image 9 km x 9 km) September 7, 2000 Burn scars
Aerosol Effects on Reflected Solar Radiation over Land Biomass burning Cuiabá, Brazil (August 25, 1995) 10 km q0 = 36° R = 0.66 µm G = 0.55 µm B = 0.47 µm R = 1.65 µm G = 1.2 µm B = 2.1 µm 20 km AVIRIS Data
Madikwe Fire 20 August 2000 24°44’S 26°13’E 0847 UTC Red = 0.66 µm Green = 0.55 µm Blue = 0.47 µm Flight Direction 36.0 km 6.4° q0 = 43.0° f0 = 33.8° f-f0 = 62.6° 36.0 km
Madikwe Fire 20 August 2000 24°44’S 26°13’E 0847 UTC Red = 3.75 µm Green = 2.30 µm Blue = 1.64 µm Flight Direction 36.0 km 6.4° q0 = 43.0° f0 = 33.8° f-f0 = 62.6° 36.0 km
20 August 2000 24°44’S 26°13’E 0847 UTC Madikwe Fire q0 = 43.0° f0 = 33.8° f-f0 = 62.6° Red = 3.75 µm Green = 2.30 µm Blue = 1.64 µm Flight Direction 36.0 km 6.4° 36.0 km
First Year Ice – Chukchi Sea 22 May 1998 72°14’N 157°07’W 2136 UTC Red = 2.13 µm Green = 1.62 µm Blue = 0.55 µm Flight Direction 37.2 km 166° q0 = 52.3° f0 = 165.5° f-f0 = 89.5° 37.2 km
Stratus over Open Water 22 May 1998 71°14’N 157°27’W 2211 UTC Red = 2.13 µm Green = 1.62 µm Blue = 0.66 µm Flight Direction 37.2 km 348.2° q0 = 50.9° f0 = 175.4° f-f0 = 82.8° 37.2 km
Stratus over Open Water 22 May 1998 71°14’N 157°27’W 2211 UTC l = 0.66 µm Flight Direction 37.2 km 348.2° q0 = 50.9° f0 = 175.4° f-f0 = 82.8° 37.2 km
Stratus over Open Water 22 May 1998 71°14’N 157°27’W 2211 UTC l = 1.62 µm Flight Direction 37.2 km 348.2° q0 = 50.9° f0 = 175.4° f-f0 = 82.8° 37.2 km
Source of Tangential Scale Distortion • Many airborne and spacecraft sensors have constant angular scanning • Image distortion along scan
Tangential Scale Distortion in Unrectified Across-track Scanner Imagery Vertical aerial photograph Cross-track scanner image
= qp yp ymax qmax yp qmax ymax Tangential Scale Distortion Correction qp = Yp = H¢tanqp
Raw MAS Image of Point Barrow 3 June 1998 71°22’N 156°41’W 0106 UTC Red = 1.62 µm Green = 0.75 µm Blue = 0.47 µm Flight Direction 37.2 km 151.8° q0 = 54.2° f0 = 227.6° f-f0 = 165.8° 37.2 km
Rectified MAS Image of Point Barrow 3 June 1998 71°22’N 156°41’W 0106 UTC Red = 1.62 µm Green = 0.75 µm Blue = 0.47 µm Flight Direction 37.2 km 151.8° q0 = 54.2° f0 = 227.6° f-f0 = 165.8° 37.2 km
Across-track Scanner Imagery Distortions Induced by Aircraft Attitude Deviations
Sample Calibration Curve Used to Correlate Scanner Output with Radiant Temperature Measured by a Radiometer e.g., 0, 1,35, 1002, Etc. Digital number Energy (w/m2)
Sample Calibration Curve Used to Correlate Scanner Output with Radiant Temperature Measured by a Radiometer Energy->voltage->digital number W/m2
MODIS/ASTER Airborne SimulatorIvanpah Playa, Mojave Desert, California 2.395 µm 0.945 µm 0.460 µm 1.625 µm Port 1 Port 2 25 120 20 100 15 Radiance Radiance 80 10 5 60 0.5 0.6 0.7 0.8 0.9 1.8 2.0 2.2 Wavelength (µm) Wavelength (µm)
MODIS/ASTER Airborne SimulatorIvanpah Playa, Mojave Desert, California 5.25 µm 12.75 µm 3.15 µm 7.90 µm Port 3 Port 4 2.5 11 2.0 10 1.5 Radiance Radiance 9 1.0 8 0.5 7 3.5 4.0 4.5 5.0 8 9 10 11 12 Wavelength (µm) Wavelength (µm)
Selected Laboratory Spectra of Minerals in the Shortwave Infrared • Spectra are displaced vertically to avoid overlap • The bandwidth of band 7 of the Landsat Thematic Mapper is also shown
Selected Laboratory Spectra of Green Leaves • Spectra are displaced vertically to avoid overlap • The percent reflectance at 1.3 µm is provided for each spectrum