Download
1 / 18
180 likes | 200 Vues
Practice interpreting graphs of plant growth to answer questions. Use the provided graph and Helen's graph to record answers in your notebook.

E N D
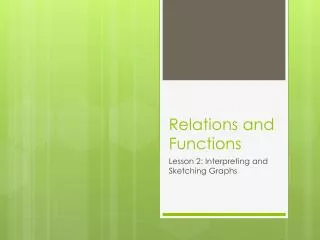
STC Plant Growth and DevelopmentLesson 15: Interpreting GraphsKennewick School District
For each student: Student notebook Student Activity Book STC Plant Growth and Development Lesson 15: Interpreting Graphs Materials list
STC Plant Growth and Development Lesson 15: Interpreting Graphs You have made a lot of progress being able to make graphs of you plant’s growth.Today we will practice getting information from graphs.
STC Plant Growth and Development Lesson 15: Interpreting Graphs Open your Student Activity Book to page 44 in Lesson 15 and spend a few minutes studying the graph. The graph is a comparison of how long it takes for five different plants to make seeds.Use the graph to answer the questions on page 43. Record your answers in your science notebook.
STC Plant Growth and Development Lesson 15: Interpreting Graphs Which plant has the shortest life cycle? Number of days needed to develop seeds
STC Plant Growth and Development Lesson 15: Interpreting Graphs What is the title of the graph? Which plant has the shortest life cycle? Number of days needed to develop seeds
STC Plant Growth and Development Lesson 15: Interpreting Graphs How many days does it take for the Wisconsin Fast Plants to develop seeds? Which plant has the shortest life cycle? Number of days needed to develop seeds
STC Plant Growth and Development Lesson 15: Interpreting Graphs After Wisconsin Fast Plants, what is the next fastest plant to develop seeds? Which plant has the shortest life cycle? Number of days needed to develop seeds
STC Plant Growth and Development Lesson 15: Interpreting Graphs How many days does it take for pea seeds to develop? Which plant has the shortest life cycle? Number of days needed to develop seeds
STC Plant Growth and Development Lesson 15: Interpreting Graphs How many more days does it take for lima beans to develop seeds than corn? Which plant has the shortest life cycle? Number of days needed to develop seeds
STC Plant Growth and Development Lesson 15: Interpreting Graphs Every fourth year, it was Helen’s turn to spend the summer at Grandma and Grandpa’s farm. Even before she had time to unpack, Grandma would always say, “Let’s see how much you’ve grown since the last time you were here.” Then the three of them would stroll out to the barn together. Right next to Chester the horse’s stall was a smooth plant wall. This was Helen’s measuring place. Helen would stand up straight with her heels to the wall, and Grandpa would draw a line across the plank to mark her height. Each time they measured, Helen would move over one plank to the right. And she always wrote her age under the measurement. By the time she was 20 years old, that wall looked just like a graph!
STC Plant Growth and Development Lesson 15: Interpreting Graphs Use Helen’s Graph to answer the questions in the Student Activity Book. Record your answers in your notebook. When everyone has finished, we’ll discuss the answers together.
STC Plant Growth and Development Lesson 15: Interpreting Graphs Helen’s Graph
STC Plant Growth and Development Lesson 15: Interpreting Graphs Helen was 45 cm long at birth. By the time she was ready to spend her first summer in the country at age 4, she was more than twice that tall. How tall was Helen at age 4? Helen’s Graph
STC Plant Growth and Development Lesson 15: Interpreting Graphs Helen’s Graph Grandpa was big on safety. He insisted that no one could ride Chester alone unless that person was at least 125 cm tall. When she was only 4 it seemed like a good rule. But by the time she was 8, Helen was dreaming of riding solo. Did she get her wish that summer when she was 8?
STC Plant Growth and Development Lesson 15: Interpreting Graphs Grandpa had another rule. You had to be at least 150 cm tall to drive the tractor. How old was Helen when she was first allowed to drive the tractor? Helen’s Graph
STC Plant Growth and Development Lesson 15: Interpreting Graphs At 12, Helen was right in the middle of her adolescent growth spurt. How much taller is she at 12 than she was at 8? Helen’s Graph
STC Plant Growth and Development Lesson 15: Interpreting Graphs Grandma and Helen stood back to back at the end of her 16th summer and discovered they were exactly the same height, 165 cm. Do you think they were still the same height when Helen was 17 years o ld? Give a good reason for your answer. Helen’s Graph