
Understanding the Normal Distribution: Analysis and Computation Techniques
This piece explores the concept of the normal distribution and its applications through various examples. It highlights how to analyze data on a quantitative variable using graphical plots, numerical summaries, and mathematical models. Specific case studies, including blood pressure distributions and student test scores, illustrate the properties of the normal curve, and the guidelines for calculating areas under the curve. It covers standardization, the 68-95-99.7 rule, and practical applications in evaluating performance relative to the mean.

Understanding the Normal Distribution: Analysis and Computation Techniques
E N D
Presentation Transcript
Examining data • When examining data on a single quantitative variable: • Plot the data • Look for overall pattern • Calculate a numerical summary to briefly describe center and spread • When the overall pattern is quite regular, use a compact mathematical model to describe it.
Describing data with a smooth curve Distribution of blood pressure: The histogram shows 1,000 blood pressures
Describing data with a smooth curve Vocabulary scores of 947 seventh-grade students in Gary, Indiana.
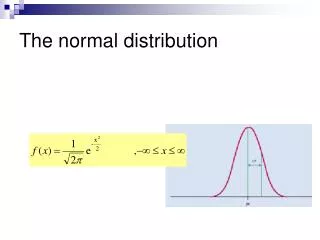
The normal curve(The Normal (Gaussian) distribution) Normal curve has a a particular symmetric, bell- shaped pattern, which can be summarized with this equation: Notation: e.g., SAT scores ~ N(505,1102)
Changing μ and σ Changing μ changes the center Changing σ changes the spread
The 68-95-99.7 rule f(x) -3σ-2σ -σμσ 2σ 3σ 68% of observations fall within σ of the mean μ. 95% of observations fall within 2σ of the mean μ. 99.7% of observations fall within 3σ of the mean μ.
Area under the curve represents proportion of observations = relative frequency From the histogram: Relative frequency of scores less than or equal to 6 is 0.303 (287 students out of total 947) From the normal curve: area under curve that is less or equal to 6 is 0.293
How can we calculate area under the curve? Problem: Integrating over the formula of the N(μ,σ) Curve involves difficult numerical computations. Also, For different sets of (μ, σ) we need to perform a new calculation The solution: we standardize the N(μ, σ) to have common μ and σ μ=0 and σ=1. There are tables that already performed these computations for the N(0,1)
The standard normal distribution Normal variables may have different μ and σ: All normal distributions are the same if we measure in units of size σ about the center μ. We can standardize each normal variable to have μ=0 and σ=1
The standard normal distribution • This is the normal distribution with μ=0 and σ=1 and denoted N(0, 1). • If the variable X has a normal distribution N(μ,σ) then
Example • Women’s height is N(64.5,2.52) Mary’s height is 67. Her standardized height is Mary’s height is 1 standard deviation above the mean
Example • Reading ability of third grade children is N(75, 102). • Reading ability of sixth grade children is N(82, 112). • David, 3rd grade, scored 80. • Nancy, 6th grade scores 80. • Who scored better relative to the their grade? • David’s standard score is (80-75)/10=0.5 • Nancy’s standard score is (80-82)/11=-0.18 • Relative to their grades,David scored higher than Nancy,
Using the Normal table to compute area under the Normal curve Table entry z
Examples of using the Normal table Φ(-1.5) = 0.0668 6.7% 1. - to -1.5 -1.5 Φ(-1.51) = 0.0655 6.6% 2. -∞ to -1.51 -1.51 1- Φ(1.5) = 1-.9332 = 0.0668 6.7% 3. 1.5 to ∞ 1.5 Φ(1.5)-Φ(-1.5)=0.9332-0.0668= =0.8664 86.6% 4. -1.5 to 1.5 -1.5 1.5
Problems: 15% of normal curve lies to right of what value? go to answer Find area under normal curve between -2 and -1 go to answer 85% lies to the right of ________ go to answer 25% lies to the right of ________ go to answer Go to Computations for a non-standard normal distribution
Answer: 15% a We are looking for a Go to the Normal table and look for value of z with 85% to its left. We denote it by z0.85 a = Z0.85 = 1.035 Back to problems
? Answer: -2 -1 Φ(-1)-Φ(-2) = 0.1587-0.0228 = 0.1357 13.5% Back to problems
85% Answer: x X = Z0.15=-1.035 Back to problems
Answer: We are looking for x X is the value of z with 85% TO ITS LEFT X = Z0.75= -0.67 25% x Back to problems
Computations for a non-standard normal distribution Assume that: What % of people have IQ between 85 and 115? • To use the normal table we have to transform to standard units What ? 85 115
To transform the point x to standard units compute: This tells us how many standard deviations x is from the average μ
Back to our IQ problem – Convert 85 and 115 to standard units: 68% 85 100 115 -1 0 1
What % of people have IQ below 100? 100 Answer: 50%
What % of people have IQ below 80? 80 100 -1.33 0 Convert 80 to standard units: Find area using normal table: Answer: 9.18%
What % of people have IQ above 140? 0 2.666 100 140 Convert 140 to standard units: Area to the left of 2.666 Area to the right of 2.666 1-0.9961=0.0039 Answer: 0.39%
What % of people have IQ between 100 and 120? 100 120 0 1.33 Convert 120 to standard units: Subtract the area below 0 from the area below 1.33: Area below 0 = 0.5 Area below 1.33 is 0.9082 0.9082-0.5=0.4082 Answer: 40.8%
What is the min score that someone must achieve to be in the top 5? 5% 100 x ? First, find what standard score is appropriate: Find IQ value that is 1.645 standard deviations above the mean X=124.75
Question: Scores on the SAT verbal test follow approximately N(505,1102) distribution. 1. What percent of students have scores higher than 700? ? 700 Transform 700 into standard units: (700-505)/110=1.77 1-0.9616=0.0384 1.77 Answer: 3.84%
? 2. What percent of students have scores between 505 and 700? 505 700 Transform to standard scores: (700-505)/110=1.77 (505-505)/110=0 ? Φ(1.77)-Φ(0)=0.9616-0.5=0.4616 0 1.77 Answer is 46.16%
3. How high must a student score in order to place in the top 10% of all students taking the SAT? 10% X First find the standard score that is below the top 10% Find SAT score that is equivalent to 1.285 z score X=645.8 Answer is 645.8
Homework stat 1000 • 1.43 page 59 • 1.63 page 63 • 1.77 page 87 • 1.83 page 88 • 1.86 page 89 • 1.87 page 89 • 1.89 page 89 • 1.91 page 90 • 1.95 page 90 • 1.115 page 97 Homework 2 Appear on Course web under: “assignments”
Go to Applet http://psych.colorado.edu/~mcclella/java/normal/handleNormal.html


