Download
1 / 16
160 likes | 333 Vues
Hidden Markov models for detecting remote protein homologies. Kevin Karplus, Christian Barrett, Richard Hughey Georgia Hadjicharalambous. Brief outline. Description and evaluation of a new hidden Markov model method, SAM-T98, for finding remote homologs of protein sequences.

E N D
Hidden Markov models for detecting remote protein homologies Kevin Karplus, Christian Barrett, Richard Hughey Georgia Hadjicharalambous
Brief outline • Description and evaluation of a new hidden Markov model method, SAM-T98, for finding remote homologs of protein sequences. • Evaluation with three fold-recognition test datasets and a curated database. • Comparison with WU-BLASTP and DOUBLE-BLAST • Results
1.Biology background • Homologs: chromosomes carrying the same genetic loci; • Structure of a protein can be predicted by using a homology to sequences for which the structure is known. • Similar structures similar functions • Can classify proteins into families with similar functions. • Remote-homolog Detection
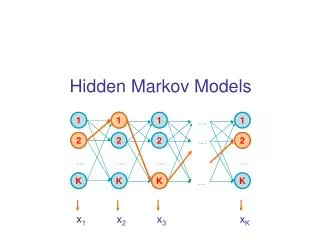
2.Statistics background • Hidden Markov Models • Q=set of states={match, insert, delete} • V=output alphabet={20 amino acids} • (i)=probability of being in state i, at time t=0 • A=transition probabilities={aij}, where aij=Pr[entering state j at time t+1| in state i at time t] • B=output probabilities={bj(k)}, where bj(k)=Pr[producing vk at time t | in state j at time t]
HMMsas profile models • Homologs are chromosomes carrying the same genetic loci; a diploid cell has 2 copies of each homolog, one derived from each parent. • A profile of a protein family is a labeling of the positions of the amino acids in the secondary structure and a probability distribution for each position. • The structure of a protein can be predicted by using a homology to sequences for which the structure is known. Proteins with similar structure assumed to have similar functionclassification of proteins into families according their function.
Typical Profile HMM: • chain of match, insert and delete states. • Specific probabilities to all transitions between nodes and character costs in match and insert states. • BEST PATH: a single path from ‘Start’ to ‘End’ and each character is related to a successive match or insertion state along the path.
For this work: • Local alignment procedure was used: relates part of the sequence to one contiguous path through part of the HMM. • An HMM is trained on sequences-members of protein family, the resulting HMM identifies the positions of amino acids which describe structure of family. use this HMM to discriminate family members.
TEST SETSFold recognition datasets • FSSP: based on a protein classification tree (Holm and Sander, 1996, 1997) presents a continuously updated structural classification of 3-dimensional protein folds (sequences of 1050 leaves of the FSSP tree, 166 target sequences). • Uses DALI to determine structural homology. • Classification: z-scores > 6 homologs z-scores < 2 non-homologs 2 < z-scores < 6 partly yes or no
Even with the best possible classifier, about 2% of the non-self pairs represent homologies to be detected. • At the minimum-error point for an optimal classifier, there are about 1.4% homolog pairs.
SCOP:(Structural Classification of proteins) • 2 test sets (Brenner, 1996; Park et al., 1997): identical lists for both target lists • Database of known folds • Homologous pair: if both sequences were in the same SCOP superfamily. • No 2 sequences had >40% sequence similarity. • Whole-chain test set: .6% correct homologies • Domain test set: the same
Sequence comparison dataset • Pearson:curated version of the PIR database ( Barker et al., 1990). • 12 216 sequences total • Set of 67 target sequences • .4% were considered correct • PIR families (Protein Information Resource): close homologs Pearson test is for close homolog classification, NOT remote homolog.
ALGORITHMS • WU-Blast(Basic Local Alignment Tool): • Protein identification software for genes • Set E (# of false positives) = 10 • Log of P-value reported as the score to threshold. • Optimum threshold never corresponded to P-value > .005.
DOUBLE-Blast: Inspired by ISS (Park et al., 1997), ISS was used to recognize remote revolutionary related sequence pairs derived from SCOP database. It considered to increase detection compared to FASTA. • Two-step approach: 1. Set of close homologs found to the target sequence in NRP. 2. Each homolog is used as a query to search the final database.
SAM-T98: Single target sequence: finds and multiplies align a set of homologs and creates an HMM from that multiple alignment. Resulting HMM is used then for database search. • SAM package • Database small: method is used to create an HMM for each sequence in the database. • For fold-recognition tests created HMMs for all sequences. • Pearson test only for the 67 target sequences.