Download
1 / 4
60 likes | 402 Vues
Parameters of the Bass Model in Several Product Categories. Innovation Imitation Product/ parameter parameter Technology ( p ) ( q ) B&W TV 0.065 0.335 Color TV 0.021 0.583 Room Air conditioner 0.010 0.454 Clothes dryers 0.073 0.389 Ultrasound Imaging 0.003 0.506

E N D
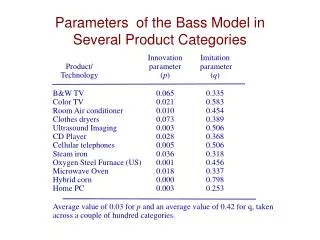
Parameters of the Bass Model in Several Product Categories Innovation Imitation Product/ parameter parameter Technology (p) (q) B&W TV 0.065 0.335 Color TV 0.021 0.583 Room Air conditioner 0.010 0.454 Clothes dryers 0.073 0.389 Ultrasound Imaging 0.003 0.506 CD Player 0.028 0.368 Cellular telephones 0.005 0.506 Steam iron 0.036 0.318 Oxygen Steel Furnace (US) 0.001 0.456 Microwave Oven 0.018 0.337 Hybrid corn 0.000 0.798 Home PC 0.003 0.253 Average value of 0.03 for p and an average value of 0.42 for q, taken across a couple of hundred categories.
Slides 1&2 don’t even agree??!! Innovation Imitation Product/ parameter parameter Technology (p) (q) B&W TV 0.108 0.231 Color TV 0.059 0.146 Room Air conditioner 0.006 0.185 Clothes dryers 0.009 0.143 Ultrasound Imaging 0.000 0.534 CD Player 0.055 0.378 Cellular telephones 0.008 0.421 Steam iron 0.031 0.128 Oxygen Steel Furnace (US) 0.002 0.435 Microwave Oven 0.002 0.357 Hybrid corn 0.000 0.797 Home PC 0.121 0.281 A study by Sultan, Farley, and Lehmann in 1990 suggests an average value of 0.03 for p and an average value of 0.38 for q.
Use Established Parameters as Estimates by Analogy… e.g., demand for HDTV? Product group p (coef-innovat) q (coef-imitation) 1) e-toothbrush, fire extinguisher .0083 .22 slow cooker, hair dryer, trash compactor, 2) e- can opener, cd’s, curling iron, .0232 .32 e- blanket, heating pad, knife sharpener, lawn mower, waffle iron 3) blender, deep fryer, food .0141 .48 processor, microwave oven 4) color tv, refrigerator, vcr .0200 .54 5) calculator, digital watch .0249 .27