Download
1 / 22
220 likes | 340 Vues
Learn about the key steps in the Scientific Method, defining variables, test groups, constants, and hypotheses. Follow Harold's hamster experiment to see how to apply the method effectively.

E N D
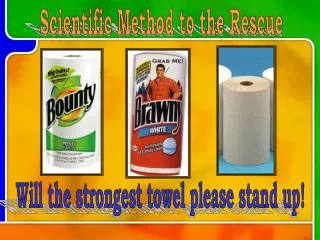
The Scientific Method[& intro to writing a lab report] Unit 1 – Lecture 2
Harold owns two hamsters – they live in separate cages, but they’re exactly the same in every other way [age, weight, cage design, etc]. Suddenly, the hamsters start gaining weight – but he has always fed them the same food [Food A] and has been feeding them the same amount. He decides to go to the store to check out new food options. A clerk at the store tells him that he’s heard of a different food, Food B, that causes less weight gain than the other foods. Harold thinks that the clerk might just be being sneaky to make a sale, so he talks to other people in the store – but they all say the same thing. He decides to purchase a small bag of Food B and test it on hamster #1 before he feeds it to his favorite hamster, #2 to see if food B will cause less weight gain. Based on talking to so many people, he thinks it probably will.
The Scientific Method • a tool used to solve problems • used by EVERYONE – not just scientists • Steps in the Scientific Method • Observe • perform Experiment • develop Problem ……Statement • collect Data • analyze Data • collect Background …… Info • form Conclusion • form Hypothesis
Defining Variables • Independent Variable [IV] • it is not changed by the other variable • [it is INDEPENDENT of the DV] • changes the other variable [DV] • “I control the IV” • Dependent Variable [DV] • is changed by the other variable [IV] [ it is DEPENDENT on the IV]
Defining Variables - Example Given the purpose statement below, what 2 things will you measure in your experiment? • Purpose: to determine whether food B will cause less weight gain than food A [normal food] in a hamster when fed over a period of 2 weeks. • Variable 1: TYPE of food • --it is important to note that you are NOT measuring the impact of the food’s color, size, shape, or other characteristic. • Variable 2: amount of weight gain
Defining Variables – cont’d The DV depends on the IV. I change the IV. Which of these sentences makes sense? ------------------------------------------------------------------------------------------------------------ • The type of food fed to the hamster depends on the amount of weight the hamster gains. • OR • The amount of weight the hamster gains depends on the type of food fed to the hamster.
Defining Variables – cont’d “The amount of weight the hamster gains depends on the type of food fed to the hamster.” • IV = type of food [“I control the IV” !!!!!] • DV = weight gain of hamster
Test Groups Two different groups in an experiment: • Control Group - group that does not receive the treatment or change • functions as a standard by which you can measure the results of your experiment • we know that what we are testing is NOT affecting this group • Hamster #2 being fed Food A [the “normal” food].
Test Groups – cont’d Two different groups in an experiment: • Experimental Group – group in the experiment which receives the change/treatment • what we are testing IS affecting this group • Hamster #1 being fed Food B [the “new” food].
Constants • Constant – something you want to remain the same throughout an experiment. • Purpose: to figure out whether food B will cause less weight gain than food A [normal food] in a hamster when fed over a period of 2 weeks.
Discuss • What things need to remain the same in order for you to be sure that ONLY the difference in type of food is causing the change in weight? • Come up with a list of 5 or more things. • What’s the Point? No Constants, No Confidence
Hypotheses • Forming a Hypothesis • If, Then format • statement, NOT a question • contains IV and DV • predicts specific outcome of the experiment • what type of change are you making? • what type of change are do you predict you’ll see? abbreviation [used frequently] for change = Δ
Hypotheses – cont’d • Types of Hypotheses • Hypothesis – predicts change in the results between the control & experimental groups • If [change] in IV, then [change] in DV • Null Hypothesis - predicts no change in the results between the groups • If change in IV, then NO CHANGE in DV.
Hypotheses – cont’d • the POINT of the NULL hypothesis is to be rejected / disproven. • it states that there’s no relationshipbetween your variables.
Discuss • Come up with a null hypothesis for each hypothesis below. [states no change or no relationship between your variables]. • Patients taking drug A for their headache will recover faster than patients taking a placebo. • NULL: Patients taking drug A for their headache will recover in the same time as patients taking a placebo. • [no change in recovery time] • Tomato plants exhibit a higher rate of growth when planted in compost rather than in soil. • NULL: Tomato plants show no difference in growth rates when planted in compost rather than soil. • [no change in the growth rate]
Performing the Experiment As part of performing the experiment, the following must be completed: • materials LIST for the experiment • contains ALL equipment used in ALL groups • contains how many of each item are used • LIST of steps in your procedure • be specific • important – need to have repeatable results
Collecting Data • Collecting data takes place during the experiment • typically in a data table • title of table contains IV and DV • IV on left, DV on right • finalized table has data in numeric order according to trial number OR in ascending order if there aren’t specific trials.
Analyzing Data • Analyzing data takes place after the experiment. • typically in graph form [IV on X-axis, DV on Y-axis] • Comparing Qualitative & Quantitative Data • types used: bar graph, pie chart • qualitative data – data involving characteristics [qualities – color, type, etc.] • quantitative data – numerical data [quantities]
Analyzing Data – cont’d • Comparing two types of Quantitative Data • scatter plot – line graph w/o the line • line of best fit – drawn through the average of the plotted points • line graph – connects the dots between sequential points
Question: • What kind of graph should we use for our hamster experiment graph? • variables: type of food, amount of weight gain
Conclusions • Conclusions contain: • a restatement of the purpose • a description of data analysis • a restatement of the hypothes(is/es) • a statement of accepting or rejection of hypothesis • & other stuff you’ll see on a rubric specific to each lab
Homework • Complete pg 6 of your Unit Packet • Simpsons & the Scientific Method w/s