Discrete Random Events
Discrete Random Events. Thurs. March 11, 1999 Review with Examples Discrete Outcome Sample Spaces Influence Diagrams & Probability Trees Moments (e.g., expectation, variance, kth central) Probability Functions (Marginal, Joint, Conditional)

Discrete Random Events
E N D
Presentation Transcript
Discrete Random Events • Thurs. March 11, 1999 • Review with Examples • Discrete Outcome Sample Spaces • Influence Diagrams & Probability Trees • Moments (e.g., expectation, variance, kth central) • Probability Functions (Marginal, Joint, Conditional) • Next week: Influence Diagrams (Tues.) and Dr. Anil Varma, Guest Speaker from GE’s AI/Expert Systems Group (Thurs.)
Example: Venn Diagram and Independence • We know from the Venn Diagram • Pr(A|B) = 1 • Pr(A) • Pr(B) • Are A and B independent? Is Pr(AB)=Pr(A)Pr(B)? A B ? A B
Disk Drive Failure Example Pr(C) =Pr(CI) = Pr(CX) + Pr(CX’) = 0.6 + 0.1 = 0.7 Pr(X) = Pr (XI) =Pr(XC) + Pr(XC’) 0.6 + 0.2 = 0.8 Pr(C|X) =Pr(CX)/Pr(X) = 0.6/0.8 = 0.75 ? c (C, C’) x (X, X’)
Outcome Sample Spaces • It is useful in performing probability manipulations to define the random events "Ei" as unions of elementary mutually exclusive and collectively exhaustive events. • Outcome sample spaces are analogous to Venn diagrams where the universe I, is made up of these elementary mutually exclusive and collectively exhaustive events. • The probability of any event Ei is then the sum of the probabilities (due to the mutual exclusivity) of the elementary events which comprise Ei.
Talus Bone Example • Assume that we are to roll two "fair" talus bones; one is the heel bone of a sheep, the other is a heelbone of a deer. Each one has four sides, and if it is "fair" the likelihood of any one side coming up on a roll is equally likely. • Let us further assume that each side of the talus bone has dots on it one dot, two dots, three dots and four dots (similar to a conventional die but with four sides instead of six).
Talus Bone Events • Assume both the sheep and deer talus bones are thrown randomly on the ground. Define the events: • Si = the number of dots on the up side of the sheep talus bone. • Dj = the number of dots on the up side of the deer talus bone. • Assume the throw of the sheep bone is independent of the throw of the deer bone, • Pr(SiDj ) = Pr(Si )Pr(Dj )
Sample Space for Joint Events • The joint events DiSj (i,j = 1, 2, 3, 4) represent the 16 possible outcomes independent rolls for each talus bone. • The probability of rolling any side is equal to 1/4 for each bone. • Thus Pr(DiSj ) = Pr(Di ) Pr(Sj ) = (1/4)(1/4) = 1/16 Deer Talus Sheep Talus
Example: Find probability of E4 = the event that the sum of the two numbers is four. Deer Talus • Because the events are mutually exclusive, the probability of event E4 is 1/16 times the number of ways a sum of four can occur. • There are three events that sum to four and thus: Pr(E4) = 3(1/16) = 3/16 Sheep Talus
Example: F<10 = the event that the product of the two numbers is less than ten • Because the events are mutually exclusive, the probability of event F<10 is 1/16 times the number of ways a product less than ten can occur. • There are thirteen events with a product less than ten and thus: • Pr( F<10 ) = 13(1/16) = 13/16 Deer Talus Sheep Talus
What if the Talus Bones are Biased? • Suppose the probability of getting four dots is higher than getting three and so on as defined by the probability distribution: 2i-1 Pr(Si) = Pr(Di) = ------ 16 Probability Mass Function on Si and Di
Biased Talus Bones - Probability Mass Function? • Because these events are mutually exclusive and collectively exhaustive, the sum of the probabilities of all events Si or Di equal one. Consider the sheep talus: • ∑i=1,4 Pr(Si) = 1 = 1 + 3 + 5 + 7 16 Probability Mass Function on Si and Di
Biased Talus Bones - Joint Probabilities Deer Talus Sheep Talus Joint Probabilities, Pr(Si, Di) x 256 Probability Mass Function on Si and Di
Conditional Probability Expansions of Talus Bone Example • How would one represent events E4 and F<10 as a conditional probability expansion? There are many possible and consistent representations. • If you find it natural to think of the sum of the outcomes of the tosses to be influenced by the outcome of each individual toss, state E would be expressed mathematically by the following expansion: Pr(E) = Pr(Sum(Di and Sj) ) =Pr( Sum(Di and Sj) | Di ,Sj ) Pr( Di | Sj) Pr(Sj ) • Because Di and Sj are assumed to be independent, this reduces to: Pr(E) =Pr(Sum(Di and Sj)) =Pr( Sum(Di and Sj) | Di ,Sj ) Pr( Di) Pr(Sj )
Influence Diagrams & Talus Bone Example: E4 • Because Di and Sj are assumed to be independent, this reduces to: • Pr(E) =Pr(Sum(Di and Sj)) =Pr( Sum(Di and Sj) | Di ,Sj ) Pr( Di) Pr(Sj )
Influence Diagrams & F<10 Example: • Pr(F) = Pr(Product(Di and Sj) ) =Pr( Product(Di and Sj) | Di ,Sj) Pr( Di | Sj) Pr(Sij) • Because Di and Sj are assumed to be independent, this reduces to: • Pr( Product(Di and Sj) | Di ,Sj) Pr( Di ) Pr(Sj )
How do we represent both events E and F in the same influence diagram? • Both diagrams show Di and Sj as being independent, which would remain unchanged for the combined diagram. But should there be an arc between E and F? • The question to be answered is: given we know the outcome of Di and Sj, would knowing the product give us any new information about the sum and vice versa. The answer is NO, and thus there is no arc between E and F. E and F are said to be conditionally independent of each other given Di and Sj.
E and F are said to be conditionally independent of each other given Di and Sj • Given we know the outcome of Di and Sj, knowing the product give us any new information about the sum and vice versa. • The lack of an arc reveals this conditional independence graphically.
E Sum Are E and F independent if we do not conditional information on D and S? • Given we know the outcome of Di and Sj, knowing the product give us any new information about the sum and vice versa. • The lack of an arc reveals this conditional independence graphically. ? F Product
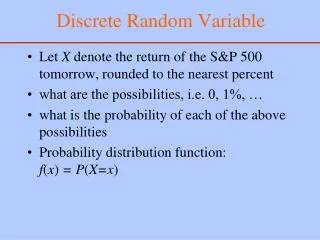
Expectation of a Random Variable • E(x|H) = ∑ xi Pr(xi) "xi or E(x|H) = <x|H>
Expectation of a Function of a Random Variable • Let g(x) be any single-valued function of the random variable x. • The expected value of g(x) is designated as E[g(x)] and defined as: E[g(x)] = ∑ g(xi)Pr(x=xi) = <g(x)> • Is E[g(x)] = g[E(x)]?
Probability Mass Function, Pr(x) • The probability that the random variable x takes on the discrete value xo is defined by means of the probability mass function Pr(x) with the notation below: Pr(x) = Pr(x=xi) for all xi Biased Talus Bone Example
Cumulative Probability Distribution, Pr(x≤y|y) Pr(x≤y|y) = ∑ x≤y Pr(x) = Pr(x≤y|y=yi) for all yi Biased Talus Bone Example
Cumulative Probability is Summation (Integral) of the Mass Function Cumulative Probability Distribution Probability Mass Function
Complementary Probability Distribution, Pr(x>y|y) Pr(x>y|y) = 1 - Pr(x≤y|y) Biased Talus Bone Example
Joint Discrete Mass Functions Two Representations for Joint Probability Mass Function for Two Biased Talus Tosses
Bayesian Pair of Bolts • Suppose that a "pick and place" robot with two manipulators has been designed to pick two bolts of the same size from a bin and place each pair in separate containers on a belt for assembly. Suppose also that there are three different kinds of pairs of bolts that are used in the assembly of this product: Pair 1 two bolts both made of alloy A Pair 2 two bolts both made of alloy B Pair 3 one of alloy A and the other of alloy B
Bayesian Pair of Bolts: Bayes Theorem • The alloys look identical and the only way to determine whether one is A or B requires performing a test. • Suppose that one of the pairs of bolts falls on the ground and the operator picks it up. The probability of getting any specific pair is 1/3. • Now suppose she randomly picks one of the bolts from the pair, performs a test on it and determines that it is made of alloy A. • What is the probability that the other bolt is of alloy A?
Bayesian Pair of Bolts: Define Events • A common erroneous answer to this question is 1/2. But this is incorrect! Define the following events: • P1: The event that pair 1 was picked. • P2: The event that pair 2 was picked. • P3: The event that pair 3 was picked. • A1: The event that the first member of the pair is of alloy A. • A2: The event that the second member of the pair is of alloy A. • B1: The event that the first member of the pair is of alloy B. • B2: The event that the second member of the pair is of alloy B. • What we want to know is Pr(A2|A1,S). We know that Pr(P1|S) = Pr(P2|S) = Pr(P3|S) = 1/3. Using Bayes' theorem and conditional probability find Pr(A2|A1,S).