Download
1 / 14
140 likes | 307 Vues
Height and shoe size. GROUP FIVE Shaun A. Nichols Shaleen Teresinski. Identify research objective. Formulate research question - Is height related to shoe size in adult women in Salt Lake City, Utah ? Identify possible Lurking Variables

E N D
Height and shoe size GROUP FIVE Shaun A. Nichols ShaleenTeresinski
Identify research objective • Formulate research question - Is height related to shoe size in adult women in Salt Lake City, Utah? • Identify possible Lurking Variables - Shoe size varies by type of shoes, country, age, ethnicity, or gender?
Collection of data • This was an observational study • Explanatory variable is shoe size, response variable is height. • Data was randomly collected for every n=4 adult female. • A survey was used to collect the information • Sample size n=47
DATA DESCRIPTION • Shoe Size statistical summary – Five number summary 5, 7, 8, 9, 13 - Mean= 7.989 - Mode= 7, 7.5, 8, 9 - Range= 8 - Standard deviation= 1.545 - Outliners= 13 • Approximately normally distributed with a slight right skew
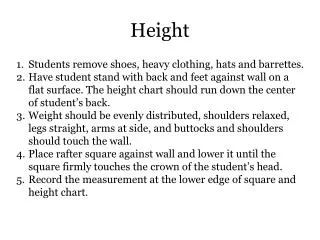
DATA DESCRIPTION • Height statistical summary – Five number summary 59.9, 63, 64, 66, 71 - Mean= 64.5 - Mode= 64 - Range= 11.1 - Standard deviation= 2.801 - Outliners= 71 • Approximately normally distributed, slight right skew
INFERENCE(positive linear relationship) • The correlation between the 2 variables is r=.967, which shows a strong linear correlation. • Correlation between Sort(var1-Height) and Sort(var2-Shoe size) is: 0.9669634 • Equation for Line of Regression: - y=1.7x-104
inference • No statistically significant relationship based on a critical value lower than .381 • Critical value for this experiment is .266 • Based on the data the inference can be made that there is no significant relationship between height and shoe size in adult women in Salt Lake City, Utah?