
Comparing groups
E N D
Presentation Transcript
Research questions • Is outcome of birth related to deprivation? • Are surgical and conservative treatments equally effective in resolving schapoid lunate fractures? • Does survival from diagnosis to death vary with Dukes’ score?
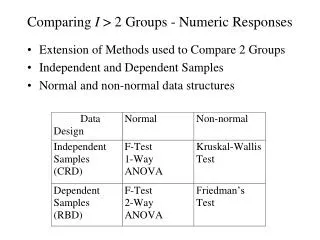
Issues in comparing groups • Type of data • Categorical • Ordered • Unordered • Continuous • Survival • Dependence of observations • Different case • Same cases or matched cases • Number of groups Wot Test?
So – WOT test? • Categorical data • Chi squared • Test of association • Test of trend • Continuous data • Normal (plausibly!) • Two groups • t tests • More than two groups • ANOVA • Survival data • Logrank test
Categorical data • Are males and females equally likely to meet targets to reduce cholesterol? • Test of association • Example 1 • Does the proportion of mothers developing pre-eclampsia vary by parity (birth order)? • Test of trend • Example 2
Hypotheses to be tested • H0: Males and females equally likely to meet targets to reduce cholesterol • H1: Males and females not equally likely to meet targets to reduce cholesterol • Two-sided test • H2: Males are less likely to meet targets to reduce cholesterol • One sided test
The test statistic • Used to decide whether the null hypothesis is: • Accepted • Rejected in favour of the alternative • Value calculated from the data • Significance assessed from known distribution of the test statistic
Example 1: Crosstabulation • Analyse • Descriptive statistics • Crosstabs
Output • Males more likely than females to achieve the target • P<0.001
Testing for trend • When one of the classes is ordinal: • Deprivation score • Age group • Severity of disease • More sensitive Chi-squared tests are available
Example 2: Test of trend Association Trend • Pre-eclamplsia is associated with parity P=0.001 • The linear trend is significant P<0.001
Small numbers Now you’ve wrecked it! • Chi-squared not appropriate: • In a 2 by 2 table (i.e. 1 dof) • Total frequency <20 • Total frequency between 20 and 40, and smallest expected frequency <5 • In tables with more than 1 dof • More than one fifth of cells have expected frequency <5 • Any cell has expected frequency <1 • Yates’ correction for 2 by 2 table (i.e. 1 dof) • When Chi-squared not appropriate • Don’t panic!!!!! • SPSS will sort out these details • Return a message to tell you
Splitting the test statistic • To assess the contribution of one category to overall significance • Corresponding row or column removed • Test statistic recalculated • New test statistic no longer significant • The category concerned is responsible for the effect
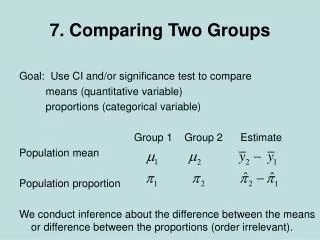
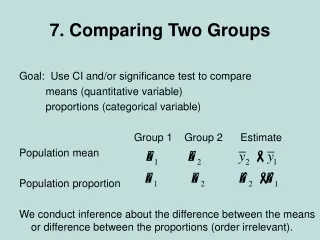
Comparing two means • Dependent • Same person • Measured on two occasions • Cholesterol • Baseline • After treatment • Measured on two matched cases • Matching on factors known to affect outcome • Age, BMI • Independent • Different people • Cholesterol at baseline in males and females
Dependent data: Example 3 • Cholesterol measured on two occasions • Baseline • After treatment • Analyse • Compare means • Paired sample t test • Assuming … • Checked distribution • Plausibly Normal
Dependent data Cholesterol reduced after treatment From 6.09 (0.036) to 3.67 (0.200) P<0.001
Independent data: Example 4 • Cholesterol measured at baseline • Males • Females • Analyse • Compare means • Independent samples t test
Independent data • Baseline cholesterol different in males and females • Males 5.83 (0.048) • Females 6.36 (0.051) • P<0.001
Comparing sample variances • Think! • If SDs are unequal, does it make sense to compare means?
Comparing more than 2 groups • ANOVA • Total variance = V • Between groups variance = B • Within groups variance = W • Ratio = B/W • No differences between groups • Ratio = 1 • Higher the ratio • Larger differences between groups
One-way ANOVA • One factor • Smoking status • Never, current, former • BMI category • Underweight, normal, pre-obese, obese • School type • Grammar, Independent, Comprehensive • Tests are: • Global between-group differences • Specific comparisons • e.g. all groups against the first • Contrasts
One-way ANOVA: Example 5 • Is baseline cholesterol related to BMI? • Analyse • General linear model • Univariate
Simple Contrasts • All pairwise combinations • Bonferroni • Specific comparisons • Contrasts • From the previous - Difference • From the first • From the last • Trend • Linear • Non-linear
Two-way ANOVA • Two factors • Time • Post-surgery review • Gender • Ethnicity
Within- and between-subject factors • Within-subjects factors • Side (left, right) • Review (pre-treatment, post-treatment) • Treatment (in a cross-over study) • Between-subjects factors • Gender • BMI
Factor or covariate? • Factors are categorical variables • Otherwise they are covariates
Two-way ANOVA: Example 6 • Is baseline cholesterol related to • BMI? • Gender?
Survival • Time between entry to study and subsequent event • Death • Full recovery • Recurrence of disease • Readmission to hospital • Dislocation of joint
What’s the problem? • Impossible to wait until all members of the study have experienced the event • Some might leave the study before the event occurred • Censored events • Survival time unknown • Times not Normally distributed
Survival methods • Life table • Events are grouped into intervals • One year, three year, five year post-op review • Survival times are inexact • Kaplan-Meier • Time at which event occurred known • Time to mobility during hospital stay • Survival times are exact • Comparing groups • Logrank test
Outcomes from analysis • Life table (life table) • One row for each interval • Survival table (Kaplan-Meier) • One row for each event or censored observation • Time to survival • Mean, median, quartiles, SE • Survival curve • Probability of no event by time t • Hazard curve • Probability of event by time t
Comparing survival in groups • Log-rank • Test of survival experience of all groups • Groups have the same survival curve • Survival is comparable for all groups • Trend • If groups are ordinal a trend test might be appropriate
Cox regression • Used to investigate effect of continuous variables on survival time • Age at diagnosis on time to death • BMI on time to dislocation • Estimates hazard ratio
Data for analysis • Time to survival • Time to event (if event occurred) • Time to end of study (censored event) • Status • Identifies cases in which the event has happened • Can be multiple • 1=Disease free, 2=Recurrence, 3=Death • Group • Treatment regime
Example 7 • Does survival from surgery to death vary with Dukes’ score?