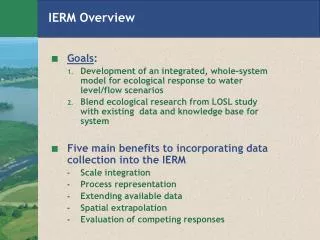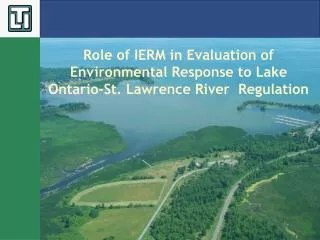
IERM Overall Objectives
IERM Overall Objectives. Quantify relationship between hydrologic and hydraulic attributes and effects on selected ecological performance indicators in the Lake Ontario/St. Lawrence River system.

IERM Overall Objectives
E N D
Presentation Transcript
IERM Overall Objectives • Quantify relationship between hydrologic and hydraulic attributes and effects on selected ecological performance indicators in the Lake Ontario/St. Lawrence River system. • Use these relationships to establish criteria that can be used in the Shared Vision Model (SVM) to provide the “acceptability or tolerance” range for each H&H attribute. • Serve as tool to assist ETWG in developing alternative regulation plan proposals.
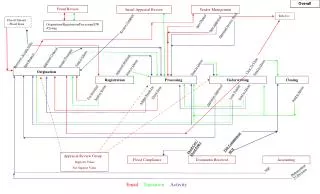
Computational Flow in IERM System Geometry DEM Land cover Meteorology Solar Radiation Precipitation Air Temp Wind Initial Conditions Population Biomass Bottom substrate Management Actions Fish stocking/ harvesting Land use Nutrient loads Natural Stressors ANS (e.g., zebra mussels) Fish-eating birds Lake and upper River Water level time series Flow at Moses-Saunders Dam Tributary inflows to lower river Temperature in lake Velocity in upper river Velocity & water levels in lower river Temperature in upper river Temperature in lower river Wetland habitat Plant community Lake and upper river Wetland habitat Plant community lower river Impoundment habitat Plant community Lower river Fish habitat WUA Lake Fish habitat WUA Upper river Fish habitat WUA Lower river Fish Bioenergetics Lake Fish Bioenergetics Upper river Fish Bioenergetics Lower river Dabbling ducks - LR Fish pop/comm dynamics Lake Fish pop/comm dynamics Upper river Fish pop/comm Dynamics Lower river Wetland birds - LR Wetland bird HSI Muskrat abundance Lake and upper river Muskrat abundance Lake and upper river Wetland bird metrics
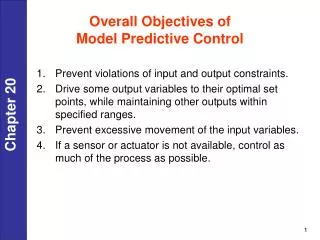
Properties of IERM • Time-dependent deterministic model • Computation flows from plan-driven H&H attributes to ecological endpoints (measures of PIs) • Driven by basic system geometry, hydrometeorology, and water level/flow time series for given regulation plan • Model will cover three integrated zones: Lake Ontario, upper St. Lawrence River, lower St. Lawrence River • Model will illustrate justification for H&H attribute criteria
Immediate Questions to Resolve • List all “measures of Performance Indicators” to include in IERM • Describe cause-effect pathways between H&H attributes (stressors derived from implementation of a given plan) and each Performance Indicator measure included in model • These pathways will form impact evaluation functions that may be used to establish criteria for plan formulations • Not clear if IS concept and approach in SVM will continue to be used (plan detailed meeting with SVM developers)
Wetlands Availability, diversity, and quality of plant community Annual biomass production Fish Habitat supply (WSA) (between/within year) Risk of within year habitat loss Northern pike YOY production Northern pike population, structure, size Fish guild biomass (type of guilds?) Birds Dabbling duck nesting success Dabbling duck brood survival Dabbling duck migration success Wetland breeding bird diversity Muskrat Abundance Amphibians/reptiles Indicator species diversity and abundance Special Interest species and habitats Draft – Measures of Performance Indicators
Fish Cause-Effect Pathways (Example) Water Level & Flow Temperature Fish Species/Guild Stranding Events Habitat YOY Abundance • Growth • Predation • Natural Mortality Wetland Quantity • Total Area • Inundation Area Fish Habitat WSA Wetland Quality • % Emergent Vegetation • % Floating Vegetation • % Submergent Vegetation • Cattails (Graduation) Juvenile Abundance • Growth • Predation • Natural Mortality (Graduation) Adult Abundance • Growth • Natural Mortality • Reproduction
Waterfowl Cause-Effect Pathways (Example) Lower River Water Level & Flow Total Habitat Acreage Waterfowl P.I. Nesting Success • Maximum nests • % of successful nests • by week Water Level (@ Sorel) Weekly Average (late April thru July) Brooding Success • Maximum broods • % of maximum broods • supported by emergent • marshes Growing Season Avg. (Apr-Sep) Spring Average (Apr 10 – May 7) Migration Success • Maximum waterfowl • migration • % of maximum • waterfowl migration
Waterfowl Satisfaction Curves (Lower St. Lawrence)
Other Issues to Resolve • Needs of faunal habitat characteristics/ resolution • Muskrats,amphibians, ducks, pike, palustrine birds, warm water fish guilds, etc.) • Spatial coverage and resolution by zone • Extrapolate 32 Lake Ontario wetlands to entire basin? • Use Lake Saint-Pierre Studies to “indicate” response of entire lower river? • Integration of range of time scales • From weekly to decadal • Exogenous factors of importance to each PI measure • Provided by individual specialists • How to value (express trends in terms of acceptable or unacceptable response to H&H attributes for given plan) PI measures?