History and Current State of Numerical Weather Prediction
Dive into the history of Numerical Weather Prediction (NWP) from Bjerknes to modern ECMWF systems. Learn how NWP aims to forecast atmospheric circulation dynamics accurately using mathematical approximations. Understand the operational requirements, data assimilation, limitations, and interpretation of NWP output.

History and Current State of Numerical Weather Prediction
E N D
Presentation Transcript
Weather forecasting by computer Michael Revell NIWA m.revell@niwa.co.nz
Introduction • History • Operational NWP system • Forecast model • Data assimilation • Verification • Interpretation and limitations of output
NWP History • Wilhelm Bjerknes (1904) • Suggested integrating differential equations that describe atmosphere • Lewis Fry Richardson (1922) • First attempt (WW1) • Dismal failure, but wrote method down • Estimated 64,000 people needed to do calculation • Courant, Friedrichs, Lewy (1928) • Time and space steps can’t be chosen independently • Radiosonde invented (1930) • Upper air data
NWP History (cont) • Rossby (1930+) • Simplified version of vorticity equation • Von Neuman + ENIAC (1945) • Electronic Numerical Integrator and Computer • First electronic computer • Charney (1950) • First successful numerical forecast based on vorticity equation • Satellite technology (1970+) • Much improved data coverage over sea (SH) • Faster computers + global models + improved use of initial data ECMWF (1980+)
Numerical Weather Prediction Aim: To predict future state of atmospheric circulation from knowledge of present state by using numerical approximations to the dynamical equations
Operational NWP system Requirements: • Closed set of appropriate physical laws • Expressed in mathematical form • Accurate numerical method to integrate these equations forward in time • Suitable initial and boundary conditions • (on the globe no lateral boundaries)
Closed set of appropriate physical laws • Conservation of momentum (u,v,w) • Conservation of energy (T) • Conservation of mass (p) • Conservation of water substance (r) • 6 equations – 6 unknowns
Expressed in mathematical form • Example: • With c a specified speed • q(x,0) a known initial condition
Accurate numerical method to integrate these equations forward in time • Approximate with centred differences • Giving
An NWP cycle • Get first guess at current situation • Usually 3 or 6 hr forecast • Make new observations • (Generally not at model grid points) • Interpolate these to model grid points • Filter out information the model can’t resolve • Step the model forward (3 or 6 hrs) • Use this forecast to repeat from step 1.
Time (hours) 0 3 6 9 12 A 48 h forecast bkg bkg 3 h forecast A A obs obs obs 3 h forecast… bkg 48 h forecast A NZLAM-VAR: Forecast-Analysis Cycle
Simple! So why are forecasts not perfect? Over recent years there have been dramatic improvements, but there remains • Model error • Models now solve the conservation laws quite accurately down to the scale of the grid • Still have to represent the effect of scales that the model doesn’t resolve (parameterize) • Cumulus clouds • Mixing / diffusion • Surface friction • Surface energy balance • Radiation (dependent on moisture) • chemistry These are predominantly the sources and sinks for our conservation laws
Model error • Specifying the initial and boundary conditions is still a problem – lack of good data • This is being improved by remotely sensed satellite data • Better methods to utilise it • This has improved SH forecasts by ~ 2-3 days
Brisbane Invercargill Conventional Data • TEMP: 12 & 24 h • PILOT: 12 & 24 h • Ships : 3 h • Buoys: ~6 h • SYNOPS: 3 h • AMDAR & AIREP
Satellite Data • TOVS / ATOVS: • NOAA14 • HIRS 2, 3, 4, 5 • MSU 2, 3, 4 • NOAA15 • AMSU 4, 5, 6, 7, 8, 9, 10, 11 • SSM/I • 1D-VAR retrievals of surface wind speed • SATWINDS • GMS atmospheric motion vectors
Forecasts • What does the output from a weather prediction model look like?
ECMWF MSLP + RH predictions
12 km NZLAM: Model Domains Uses UK Met Office Unified Model and 3DVAR Data Assimilation: • 12 km resolution domain • 324 × 324 × 38 • 4 km resolution domain • 600 × 600 × 38
4 km NZLAM: Model Domains Uses UK Met Office Unified Model and 3DVAR Data Assimilation: • 12 km resolution domain • 324 × 324 × 38 • 4 km resolution domain • 600 × 600 × 38 • 2 km resolution domain • 800 × 800 × 38 (Largest UM run to date – 360 Processors on Cray T3E)
NZLAM 10m Wind Forecast:22-Jun-05:06 UTC • NZLAM 10m Winds: • 24 h forecast Verifying QuikSCAT 10 m winds
Microphysics: Cloud Predictions NZLAM-VAR 12 hour forecast: low, low + mid, low + mid + high “Verifying” GMS 11m image for 16 Dec 1999, 1640 UTC
Verification • How good are our models at predicting weather variables?
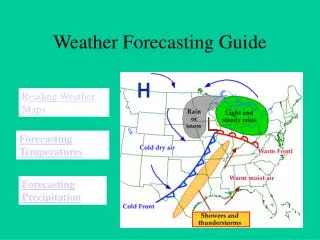
Observations “Truth” Low res. model High res. model Issues & Challenges • Right feature, wrong place?
Future • Improve data coverage • Increase grid resolution • Improve model representation of sub grid processes • How do we cope with imperfect models? • There is useful information there • How do we get at it? • Ensemble methods (probabilities) • Model output statistics (correct statistically for model biases)