Defining and Measuring Educator Effectiveness
670 likes | 926 Vues
Thursday, February 3, 2011 2:30 – 4:30 p.m. EST. Defining and Measuring Educator Effectiveness. 1. Agenda. Adobe Connect Pro. 2. 1. 3. 3. 2. Who’s With Us Today?. What Is a Regional Educational Laboratory? . Network of ten RELs Serves regional needs: Applied research

Defining and Measuring Educator Effectiveness
E N D
Presentation Transcript
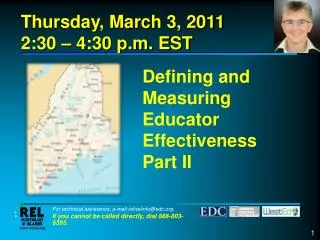
Thursday, February 3, 2011 2:30 – 4:30 p.m. EST Defining and Measuring Educator Effectiveness 1
Adobe Connect Pro 2 1 3 3 2
What Is a Regional Educational Laboratory? • Network of ten RELs • Serves regional needs: • Applied research • Development projects • Studies • Technical assistance http://ies.ed.gov/ncee/edlabs/
REL-NEI States and Territories • Connecticut • Maine • Massachusetts • New Hampshire • New York • Puerto Rico • Rhode Island • US Virgin Islands • Vermont Five-million-plus students Nearly 10,000 schools and 2,000 districts
Defining and Measuring Educator Effectiveness • Working Together • REL Northeast and Islands • National Comprehensive Center for Teacher Quality • New England Comprehensive Center • Maine Department of Education
Featured Presenter Dr. Laura Goe Research Scientist Educational Testing Service Principal Investigator National Comprehensive Center for Teacher Quality
Laura Goe, Ph.D. • Former teacher in rural & urban schools • Special education (7th & 8th grade, Tunica, MS) • Language arts (7th grade, Memphis, TN) • Graduate of UC Berkeley’s Policy, Organizations, Measurement & Evaluation doctoral program • Principal Investigator for the National Comprehensive Center for Teacher Quality • Research Scientist in the Learning & Teaching Research Center at ETS For technical assistance, e-mail relneiinfo@edc.org. If you do not have speakers or a headset, dial 888-803-6395. 10
National Comprehensive Center for Teacher Quality (the TQ Center) A federally-funded partnership whose mission is to help states carry out the teacher quality mandates of ESEA • Vanderbilt University • Students with special needs, at-risk students • Learning Point Associates, an affiliate of AIR • Technical assistance, research, fiscal agent • Educational Testing Service • Technical assistance, research, dissemination For technical assistance, e-mail relneiinfo@edc.org. If you do not have speakers or a headset, dial 888-803-6395.
The Goal of Teacher Evaluation For technical assistance, e-mail relneiinfo@edc.org. If you do not have speakers or a headset, dial 888-803-6395.
Topics to be addressed… Today’s webinar will focus on • The many definitions of teacher effectiveness and the only one that matters • When all you have is a hammer, everything looks like a nail • The value of value-added • The locked room mystery: how to evaluate teachers without ever setting foot in a classroom An upcoming webinar will zero in on • The state of a few states (and districts) • Evaluation models: strengths & weaknesses For technical assistance, e-mail relneiinfo@edc.org. If you do not have speakers or a headset, dial 888-803-6395.
Defining Teacher Effectiveness Wherein we will consider some definitions of teacher effectiveness and the only one that matters For technical assistance, e-mail relneiinfo@edc.org. If you do not have speakers or a headset, dial 888-803-6395.
Definitions in the Research and Policy Worlds • Much of the research on teacher effectiveness doesn’t define effectiveness at all though it is often presumed to be teachers’ contribution to student achievement • Bryan C. Hassel of Public Impact stated in 2009 that “The core of a state’s definition of teacher effectiveness must be student outcomes” • Checker Finn stated in 2010 that “An effective teacher is one whose pupils learn what they should while under his/her tutelage” For technical assistance, e-mail relneiinfo@edc.org. If you do not have speakers or a headset, dial 888-803-6395.
Goe, Bell, & Little (2008) Definition of Teacher Effectiveness • Have high expectations for all students and help students learn, as measured by value-added or alternative measures. • Contribute to positive academic, attitudinal, and social outcomes for students, such as regular attendance, on-time promotion to the next grade, on-time graduation, self-efficacy, and cooperative behavior. • Use diverse resources to plan and structure engaging learning opportunities; monitor student progress formatively, adapting instruction as needed; and evaluate learning using multiple sources of evidence. For technical assistance, e-mail relneiinfo@edc.org. If you do not have speakers or a headset, dial 888-803-6395. 16
Goe, Bell, & Little (2008) Definition of Teacher Effectiveness • Contribute to the development of classrooms and schools that value diversity and civic-mindedness. • Collaborate with other teachers, administrators, parents, and education professionals to ensure student success, particularly the success of students with special needs and those at high risk for failure. For technical assistance, e-mail relneiinfo@edc.org. If you do not have speakers or a headset, dial 888-803-6395. 17
Race to the Top Definition of Effective Teacher Effective teacher: students achieve acceptable rates (e.g., at least one grade level in an academic year) of student growth (as defined in this notice). States, LEAs, or schools must include multiple measures, provided that teacher effectiveness is evaluated, in significant part, by student growth (as defined in this notice). Supplemental measures may include, for example, multiple observation-based assessments of teacher performance. (pg 7) For technical assistance, e-mail relneiinfo@edc.org. If you do not have speakers or a headset, dial 888-803-6395. 18
Race to the Top Definition of Highly Effective Teacher Highly effective teacher students achieve high rates (e.g., one and one-half grade levels in an academic year) of student growth (as defined in this notice). For technical assistance, e-mail relneiinfo@edc.org. If you do not have speakers or a headset, dial 888-803-6395. 19
What Do You Think? What Attributes Are Critical to Your Definition of Teacher Effectiveness? :: USE THE CHAT TO ELABORATE ::
Teacher Evaluation Wherein we will consider the statement “When all you have is a hammer, everything looks like a nail.” For technical assistance, e-mail relneiinfo@edc.org. If you do not have speakers or a headset, dial 888-803-6395.
Research Behind the Push for New Evaluation Measures and Systems • Value-added research shows that teachers vary greatly in their contributions to student achievement (Rivkin, Hanushek, & Kain, 2005) • The Widget Effect report (Weisberg et al., 2009) “…examines our pervasive and longstanding failure to recognize and respond to variations in the effectiveness of our teachers.” (from Executive Summary) For technical assistance, e-mail relneiinfo@edc.org. If you do not have speakers or a headset, dial 888-803-6395.
Multiple Measures of Teacher Effectiveness • Evidence of growth in student learning and competency • Standardized tests, pre/post tests in untested subjects • Student performance (art, music, etc.) • Curriculum-based tests given in a standardized manner • Classroom-based tests such as DIBELS • Evidence of instructional quality • Classroom observations • Lesson plans, assignments, and student work • Evidence of professional responsibility • Administrator/supervisor reports • Surveys of students and/or parents • An “evidence binder” created & presented by the teacher If you do not have speakers or a headset, dial 888-803-6395.
Multiple Measures of Student Learning • Evidence of growth in student learning and competency • Standardized assessments (state/district tests) • Evidence collected by teachers and scored by groups of educators • The 4 Ps: portfolios, projects, products, and performances • Essays, written responses to complex questions • Evidence collected and scored in classrooms • Classroom-based assessments such as DRA, DIBELS, curriculum-based tests, unit tests For technical assistance, e-mail relneiinfo@edc.org. If you do not have speakers or a headset, dial 888-803-6395.
Teacher Observations: Strengths and Weaknesses • Strengths • Great for teacher formative evaluation • Helps evaluator understand teachers’ needs across school or across district • Weaknesses • Only as good as the instruments and the observers • Considered “less objective” • Expensive to conduct (personnel time, training, calibrating) • Validity of observation results may vary with who is doing them, depending on how well trained and calibrated they are For technical assistance, e-mail relneiinfo@edc.org. If you do not have speakers or a headset, dial 888-803-6395.
Example: University of Virginia’s CLASS Observation Tool For technical assistance, e-mail relneiinfo@edc.org. If you do not have speakers or a headset, dial 888-803-6395.
Example: Charlotte Danielson’s Framework for Teaching For technical assistance, e-mail relneiinfo@edc.org. If you do not have speakers or a headset, dial 888-803-6395.
Example: Kim Marshall’s Rubric If you do not have speakers or a headset, dial 888-803-6395.
Research on Observations: Danielson Framework • Lots of research on Danielson Framework (1996) and whether its scores correlate with student achievement growth • Goe (2007) reviews many studies, most finding weak or no correlation • Kane et al. (2010) describes research linking observation scores with value-added scores (found some small, significant correlations) • Sartain et al. (2010) describes challenges in implementation, differences researcher/principal ratings • Consortium on Chicago School Research has ongoing project studying implementation and results of replacing the “checklist” with the Danielson Framework For technical assistance, e-mail relneiinfo@edc.org. If you do not have speakers or a headset, dial 888-803-6395.
Research on Observations: CLASS • Considerable research, mostly conducted by creators of CLASS • Howes et al. (2008): children’s relationship with teachers, not teachers’ qualifications, mattered • Pianta et al. (2007): “Children from nonpoor families and who scored high on achievement at 54 months were most likely to experience classrooms high in positive emotional or instructional climate throughout elementary school. Poor children were highly unlikely (only 10%) to experience classrooms with high instructional climate across multiple grades.” For technical assistance, e-mail relneiinfo@edc.org. If you do not have speakers or a headset, dial 888-803-6395.
Federal Priorities (August 2010) • From “Race to the Top” and reiterated in the August 5, 2010 Federal Register (Vol. 75, No. 150) “Secretary’s Priorities for Discretionary Grant Programs” • Teachers should be evaluated using state standardized tests where possible • For non-tested subjects, other measures (including pre- and post-tests) can be used but must be “rigorous and comparable across classrooms” and must be “between two points in time” • Multiple measures should be used, such as multiple classroom evaluations For technical assistance, e-mail relneiinfo@edc.org. If you do not have speakers or a headset, dial 888-803-6395.
Teacher Behaviors/Practices that Correlate With Achievement • High ratings on learning environment observed in a teacher’s classroom (Kane et al., 2010) • Positive student/teacher relationships (Howes et al., 2008) • Parent engagement by teachers and schools (Redding et al., 2004) • Teachers’ participation in intensive professional development with follow-up (Yoon et al., 2007) For technical assistance, e-mail relneiinfo@edc.org. If you do not have speakers or a headset, dial 888-803-6395.
The Value of Value-Added Wherein we will consider the value of value-added For technical assistance, e-mail relneiinfo@edc.org. If you do not have speakers or a headset, dial 888-803-6395.
Most Popular Growth Models Value-added models (requires prediction) There are many versions of value-added models (VAMs), but results from the different models are quite similar Most states and districts that use VAMs use the Sanders’ model, also called TVAAS Prior test scores (3+ years in the Sanders’ model) are used to predict the next test score for a student Colorado Growth model (no prediction needed) Focuses on “growth to proficiency” Measures students against “academic peers” For technical assistance, e-mail relneiinfo@edc.org. If you do not have speakers or a headset, dial 888-803-6395. 37
Sample Student Report: Colorado Growth Model Slide courtesy of Damian Betebenner at www.nciea.org For technical assistance, e-mail relneiinfo@edc.org. If you do not have speakers or a headset, dial 888-803-6395.
What Value-Added Models Cannot Tell You • Value-added models are really measuring classroom effects, not teacher effects • Value-added models can’t tell you why a particular teacher’s students are scoring higher than expected • Maybe the teacher is focusing instruction narrowly on test content • Or maybe the teacher is offering a rich, engaging curriculum that fosters deep student learning. • How the teacher is achieving results matters! For technical assistance, e-mail relneiinfo@edc.org. If you do not have speakers or a headset, dial 888-803-6395.
Cautions About Using Value-Added for Teacher Evaluation • Braun et al. (2010) provides some useful definitions and a good review of research; notes that most researchers are not comfortable with using VAMs as the sole measures of teacher effectiveness • Schochet & Chiang (2010) “Type I and II error rates for comparing a teacher’s performance to the average are likely to be about 25 percent with three years of data and 35 percent with one year of data.” For technical assistance, e-mail relneiinfo@edc.org. If you do not have speakers or a headset, dial 888-803-6395.
Considerations in Using Value-Added for Teacher Evaluation • Koedel & Betts (2009) suggest using multiple years of data for teacher evaluation to mitigate sorting bias; novice teachers cannot be evaluated under this system • McCaffrey et al. (2009) “…there are significant gains in the stability [of teachers’ value-added scores] obtained by using two-year average performance measures rather than singe-year estimates” For technical assistance, e-mail relneiinfo@edc.org. If you do not have speakers or a headset, dial 888-803-6395.
VAMs Don’t Measure Most Teachers About 69% of teachers (Prince et al., 2006) can’t be accurately assessed with VAMs Teachers in subject areas that are not tested with annual standardized tests Teachers in grade levels (lower elementary) where no prior test scores are available Questions about the validity of measuring special education teachers and ELL teachers with VAMs For technical assistance, e-mail relneiinfo@edc.org. If you do not have speakers or a headset, dial 888-803-6395. 42
What Do You Think? :: USE THE CHAT TO ELABORATE :: What are the implications for each audience? • Students • Parents • Community members • School and district leadership • Educators • Higher education • State and local policy makers
The Locked Room Wherein we will speculate on the locked room mystery: how to evaluate teachers without ever setting foot in a classroom For technical assistance, e-mail relneiinfo@edc.org. If you do not have speakers or a headset, dial 888-803-6395.
Videotaping Instead of “Live” Observations: Pluses and minuses • Plus:Teachers’ videos can be scored from a distance • Highly-trained and calibrated raters can examine the results • Yields greater reliability and comparability across classrooms • Cost savings: no need to train local evaluators • Easy to aggregate scores to spot trends, identify problems • Minus:Teachers’ videos can be scored from a distance • Teacher does not have an opportunity to have a conversation with or question his/her evaluator • Removes one of the important benefits of observations to teachers—receiving individual, specific feedback on practice For technical assistance, e-mail relneiinfo@edc.org. If you do not have speakers or a headset, dial 888-803-6395.
Efficiency vs. Opportunity • Even if technology and data eliminates the need to ever go into a classroom, the teachers often benefit greatly from classroom visits • Informal drop-in visits • 10-min visits with a “two stars and a wish” note left in a teacher’s mailbox • Peer evaluators who can drop in regularly and provide feedback on changes they see in teachers’ practice, student engagement, etc. For technical assistance, e-mail relneiinfo@edc.org. If you do not have speakers or a headset, dial 888-803-6395.
The State of the States Tune in to the next webinar wherein we will explore a few examples of district and state evaluations systems For technical assistance, e-mail relneiinfo@edc.org. If you do not have speakers or a headset, dial 888-803-6395.
Evaluation Models • In the next webinar, we will examine the following evaluation models • Austin, TX • Delaware • Georgia • Hillsborough, FL • Rhode Island • TAP (Teacher Advancement Program) • Washington, DC • Examine these models in advance! For technical assistance, e-mail relneiinfo@edc.org. If you do not have speakers or a headset, dial 888-803-6395.
With Which of the Following Models Are You Familiar? :: CHECK ALL THAT APPLY ::