Measuring Your Success
180 likes | 324 Vues
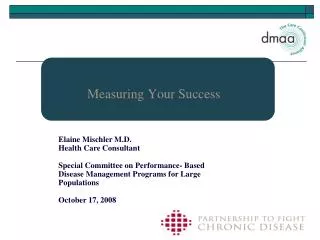
Measuring Your Success. Elaine Mischler M.D. Health Care Consultant Special Committee on Performance- Based Disease Management Programs for Large Populations October 17, 2008. In the next 20 minutes I will discuss. Suitability vs rigor in measurement

Measuring Your Success
E N D
Presentation Transcript
Measuring Your Success Elaine Mischler M.D. Health Care Consultant Special Committee on Performance- Based Disease Management Programs for Large Populations October 17, 2008
In the next 20 minutes I will discuss Suitability vs rigor in measurement Population heath services program impact model Lessons from the past Recommendations for the present Questions and concerns
Meet Alex • Age 30 • Asthmatic • One ER visit / year • Four doctor visits • 24 prescriptions • $3,000 per year in medical expense • Single parent • Pays $1,550 for health coverage
Care Management for Alex High risk • severe asthma • ready to change behavior RN calls • enters DM program Receives coaching • targeting mailing on how to control asthma Follows program • lives healthier life • avoids ER visits, complications Health Risk Assessment Compare prescription drugs and costs online Health information online Questions to ask your doctor • Chronic conditions center online • chat rooms • private emails to RN
Achieving Optimal Balance “Suitability” “Acceptability” Rigor Science Precision Replicability Bias, Confounders Causal Association Experimental Design Cost Time Ease Simplicity Accessibility Transparency Diverse Users
II. Behavior Change/Modifiable Risk Factors • I. ProcessMeasures • - Engagement Methods • - Participation Rates • - Number And Types of - Contacts • Etc… Health and Clinical Outcomes Psychosocial Drivers Health Behaviors Self-Efficacy/ Confidence Readiness to Change Risky Behaviors Social Isolation Stress/Anxiety Motivation Depression Etc…. Self-Management Proper Nutrition and Exercise Tobacco Reduction/ Cessation Medication Adherence Etc. Screening and Preventive Services Cancer Screening Lipid And Glucose Screening BP Measurement Etc. Immunizations Eye Exam Dental Care Etc…. Health Status Body Mass Index (BMI ) Cholesterol (Total, HDL, LDL) Blood Pressure Etc…. III. Productivity/ Quality of life IV. Appropriate Utilization and Medical Costs Presenteeism Absenteeism Quality of Life Short-Term* Doctor Visits Laboratory Preventive Care Medium-Term ER Visits Outpatient Pharmacy Long Term Hospitalizations Total Medical and RX Cost STD/Workers Comp Offsets Long Term Disability (*May increase $ as a result of increased screening and preventive services) Timeframe for Impact Weeks/Months Months/Years Years/Decades Population Health Services Program Impact
Disease Management Program Measurement of Impact • Calculating cost savings • Method 1 • Comparison of pre-enrollment medical expenses to post-enrollment expenses (may include adjustments) • Method 2 • Comparison of medical expenses of a managed group to a control group • Method 3 • Comparison of requested services to approved services (UM is part of the Disease Management program) Milliman USA, 2003
Problems with Savings Calculations • Regression to the mean • There is a tendency for things to return to normal • Selection bias • Members that agree to participate may be different than those who decide they will not participate .
Sample Reported ROI Milliman USA , 2003
DMAA Outcomes Guidelines Report (2006,2007,2008) Result of consensus effort to standardize methods Method based on industry best practice Effort to manage most prevalent challenges in determining outcomes Intermediate step to develop practical and reliable methods to compare programs’ performance
Recommendations cont. • Stick to the basics • Understand your goal • Start by clearly defining what you want to measure • Don’t sacrifice practicality for rigor • Require all “pilots” to “measure” alike • Start with operational process measures • Remember this takes “time” to get a result • Use resources wisely
Has heart attack Plan Members and Costs Over Time Health Risk Assessment Doesn’t work to improve health Develops Diabetes Works to improve health Joins disease management program COST Develops Diabetes Overweight High blood sugar High blood pressure Joins disease management program