Download
1 / 32
330 likes | 348 Vues
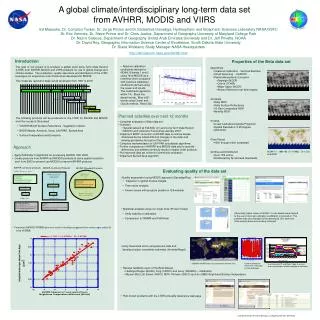
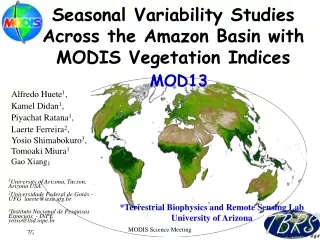
Explore the evolution of vegetation indices from AVHRR to MODIS and now VIIRS, comparing records, advancements, and future potential with insights from the science team meeting. Discover the extensive data records and their significance across different regions and applications.

E N D
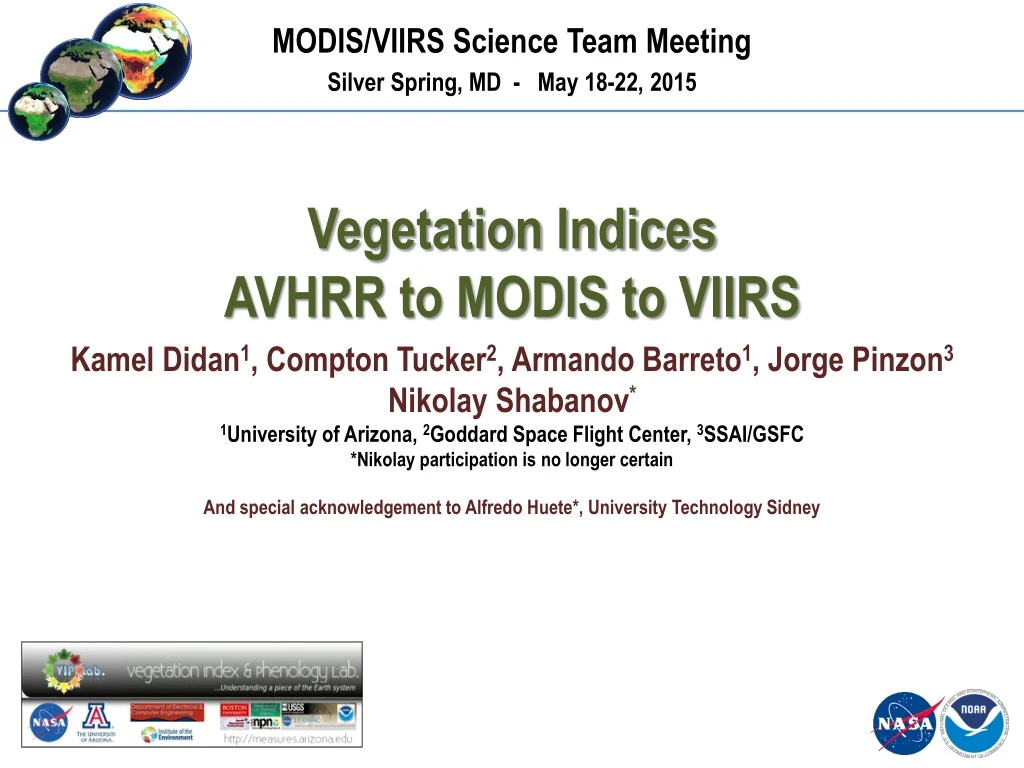
MODIS/VIIRS Science Team Meeting Silver Spring, MD - May 18-22, 2015 Vegetation Indices AVHRR to MODIS to VIIRS Kamel Didan1, Compton Tucker2, Armando Barreto1, Jorge Pinzon3Nikolay Shabanov* 1University of Arizona, 2Goddard Space Flight Center, 3SSAI/GSFC *Nikolay participation is no longer certain And special acknowledgement to Alfredo Huete*, University Technology Sidney
Main Points • To orient you here is a summary of this talk • 34+ year VI record (AVHRR, MODIS, VIIRS) • How do these records compare? • How did we do things so far? • What have we learned? • Can we do things better with VIIRS? • Continuity? Vegetation Indices: AVHRR to MODIS to VIIRS
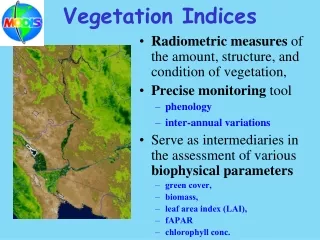
So it all started in the late seventies • Heritage in AVHRR (C. J. Tucker) • VIs are estimates of the visible light absorbed by plant canopies adjusted by their structure measured by the reflected NIR • Approximates photosynthesis, so over time NDVI = ~ GPP • Captures all biotic and abiotic factors that control photosynthesis • After 34+ years later? • MODIS VI Paper (Huete, Didan, et al., 2002) • ~2600+ citations • AVHRR GIMMS (Tucker, Pinzon, et al, 2005) • ~1200 citations • Northern Greening (Myneni,…, Tucker, et al., 1997) – NDVI based • ~2500+ citations • Highest citations in land related studies are VI related/driven • It is the highest searched/ordered/used data too Vegetation Indices: AVHRR to MODIS to VIIRS
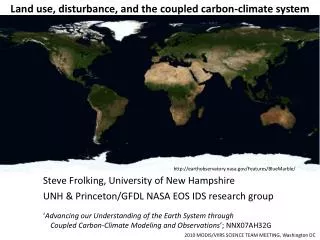
Reflections • VIs constitute probably one of the longest if not the longest consistently generated data record (RS based) • With 34+ years of Multi-sensor VI Records (AVHRR, MODIS T/A, and now VIIRS, there are others but none with the same rigor and/or consistency) • Potential to go another 25-30 years with VIIRS (S-NPP, JPSS, 2038) • Highly valuable, unique, and simple with absolutely no assumptions about anything, long term VI data record (NDVI, EVI and now EVI2) • Support to probably one of the largest multidisciplinary science user communities (from farmers to modelers) • Around 2006, a concept was proposed to reorganize our efforts around notions of climate/environmental measurements and avoid the sensor specific context • With this wealth of consistent data the questions become • What have we done right vs wrong • What have we learned • Can we do things better • What are the implications of what we do in general Vegetation Indices: AVHRR to MODIS to VIIRS
Longest RS Record African Sahel region - NDVI Multisensor Daily Time Series (AVHRR, MODIS, VIIRS) (vip.arizona.edu) Vegetation Indices: AVHRR to MODIS to VIIRS
Here is how we’ve done things so far • Ingest daily data • Atmosphere correction (partial [AVHRR] to ~full [MODIS, VIIRS]) • Per-pixel QA characterization (partial [AVHRR], extended [MODIS, VIIRS]) • Compositing over predefined periods (optimized for cloudy regions or sensor revisit period) • Select the highest NDVI (to avoid cloud, heavy aerosols, etc…) – MVC [AVHRR] • QA driven, Maximum Value Composite, and Constrained View (mitigate BRDF) • This still leaves considerable amount of poor data (>50% is still challenging to work with) African Sahel region - NDVI Multisensor Time Series (AVHRR, MODIS, VIIRS) (vip.arizona.edu) Vegetation Indices: AVHRR to MODIS to VIIRS
CURRENT RECORDS AVHRR-MODIS-VIIRS (SUMMER) AVHRR (‘95-’00) Terra (‘12-’14) Aqua (‘12-’14) VIIRS (’12-’14) EVI2 EVI NDVI MNR-FCC* *AVHRR MNR FCC was generated by correlating the VIS/NIR using the MODIS MNR~ f(VIS, NIR) relation Mid August
MODIS T/A-VIIRS (Summer) Using only the 3 yrs of overlap • Largest differencesat the low and high ends • Tropics • Deserts • Snow/Ice • VIIRS higher atthe higher endlower at the lower end
MODIS T/A -VIIRS (LSR) Using only the 3 yrs of overlap Largest differencesin the NIR and Blue
AVHRR-MODIS-VIIRS Differences (Winter) VIIRS - Sensor • Largest differencesover • Snow/Ice • Residual clouds
AVHRR-MODIS-VIIRS Differences (Summer) VIIRS - Sensor Diff < 2-5% Larger in NDVI than EVI/EVI2
AVHRR-MODIS-VIIRS Differences (Winter) VIIRS - Sensor • Largest differences • Snow/Ice (AVHRR) • Residual clouds • AVHRR Red (Snow) • NIR differences
AVHRR-MODIS-VIIRS Differences (Summer) VIIRS - Sensor Diff < 5% Mostly < 2.5%
MODIS T/A -VIIRS Difference Using only the 3 yrs of overlap
MODIS-VIIRS Difference (LSR) Using only the 3 yrs of overlap VIIRS NIR higher
Time Series Performance (Taiga) Replicates the shape and dynamic range Vegetation Indices: AVHRR to MODIS to VIIRS
Time Series performance (Desert) Different but not that bad (0.08-0.09, < 10%) Vegetation Indices: AVHRR to MODIS to VIIRS
Time Series performance (Tropics) Vegetation Indices: AVHRR to MODIS to VIIRS
Time Series performance (Deciduous, Eastern US) Vegetation Indices: AVHRR to MODIS to VIIRS
Time Series performance (Continuous crops, China) Vegetation Indices: AVHRR to MODIS to VIIRS
Data Records Correlations NDVI EVI EVI2 r2>95% Vegetation Indices: AVHRR to MODIS to VIIRS
Records Characterization • Nature of data makes assessing error, uncertainty, precision very challenging • Using field data • Establish truth (perfectly corrected data) • Compare against it using QA filtered data (validation, LPV method) • Limited representation and scaling issues • This is rather a validation of the algorithm under ideal conditions rather than real validation • Statistical approach • Calculate AVG, Calculate STDEV • Uncertainty is a range between AVG ± STDEV • Expressed as STDEV • Precision = (STDEV /AVG)*100 • Accuracy is the difference between the AVG and a true measurement (TERRA (long tern average) was used as the true measurement) http://www.ndt-ed.org/GeneralResources/ErrorAnalysis Vegetation Indices: AVHRR to MODIS to VIIRS
Global APU per LC class Remap values back on a LC map Vegetation Indices: AVHRR to MODIS to VIIRS
Global NDVI APU AVERAGE STDEV PRECISION ACCURACY Vegetation Indices: AVHRR to MODIS to VIIRS
Global EVI APU AVERAGE STDEV PRECISION ACCURACY Vegetation Indices: AVHRR to MODIS to VIIRS
Global EVI2 APU AVERAGE STDEV PRECISION (%) ACCURACY Vegetation Indices: AVHRR to MODIS to VIIRS
Residual clouds Implications on Vegetation Dynamics Tropics (Suriname) yet residual clouds make it look like a crop with definite growing season shape Vegetation Indices: AVHRR to MODIS to VIIRS
AVHRR-MODIS-VIIRS Phenology AVHRR ‘95 Terra ‘12-’14 Aqua ‘12-’14 VIIRS ’12-’14 Vegetation Indices: AVHRR to MODIS to VIIRS
Learned lessons • VIIRS will definitely continue what MODIS has started (even AVHRR), However, • Pervasiveness of Clouds, Aerosols, (especially at subpixel level) • Compositing is the only practical way to improve the data • Issues with Omission (Commission is actually OK, you simply discard) • Issues with predefined composite period • Snow/Ice background, especially early spring (partial melt) • What can we do • Need to be aggressive with clouds flagging (masking) • It is by far the most impairing to the data record • Makes no sense to generate and distribute data with clouds. Thinking back why did we do it with MODIS? • Dynamic composite period and/or shorter period • Cannot treat Tropics the same as Sahel, US Southwest, Australia for example (why fixed 16 days) • Continuity of the indices (EVI3/EVI2, transition to full EVI2) • Focus on convergence in reprocessing • The MODIS reprocessing strategy C3, C4, C5, C6 should probably not be repeated with S-NPP VIIRS • Need convergence plans or in response to validation/characterization findings? Need more flexibility • BRDF Correction : Collective solution while knowing will not satisfy everyone (what method?, what level? etc…) • Gap filling (needs creativity and more work) • Recall a MODIS/VIIRS Data user will face a simple decision [USE] or [DoNotUSE] • We need to provide them with a better way to decide and eliminate potential mistakes by reducing “garbage” data Vegetation Indices: AVHRR to MODIS to VIIRS
Project summary • Proposed product suite –EVI3 • MODIS continuity EVI-3 index (at all resolutions) • However EVI has some issues that were typically addressed by adopting a backup algorithm (earlier SAVI then a new 2-band EVI) in addition to the blue band incompatibility and poor S/N • Introduce the new 2-band EVI (start the phase out of the 3-band EVI) 2-band EVI 3-band EVI vs. 2-band EVI Vegetation Indices: AVHRR to MODIS to VIIRS
Approach – Products interdependencies • Level 3 native 375 m, and 500m, 1km, and CMG to maintain spatial continuity with MODIS • 16-day, monthly, and new quasi-daily • These choices may have to change to accommodate other land products, team consensus, feasibility, and interdependencies Vegetation Indices: AVHRR to MODIS to VIIRS