Download
1 / 34
340 likes | 576 Vues
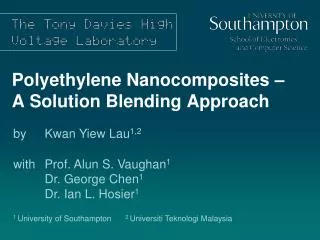
Polyethylene Nanocomposites – A Solution Blending Approach. by Kwan Yiew Lau 1,2. with Prof. Alun S. Vaughan 1 Dr. George Chen 1 Dr. Ian L. Hosier 1. 1 University of Southampton 2 Universiti Teknologi Malaysia. Introduction. Background.

E N D
Polyethylene Nanocomposites – A Solution Blending Approach by Kwan Yiew Lau1,2 with Prof. Alun S. Vaughan1 Dr. George Chen1 Dr. Ian L. Hosier1 1 University of Southampton 2 Universiti Teknologi Malaysia
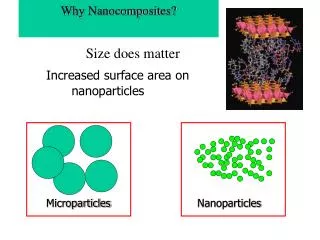
Background Polymeric insulators – widely used as standard materials in power delivery systems. The current commercial trend is to add micro-sized filler into polymer. Benefits: Enhanced mechanical & thermal properties. Trade-off: Worsened electrical properties.
Background Introduce nano-sized filler into polymer. Polymer nanocomposites / nanodielectrics. Polymers with nanometre-sized fillers homogeneously dispersed at just a few wt%.
Research Trend Opportunity! The number of publications in nanodielectrics (Nelson, 2010) • Improved breakdown strength, mitigated space charge formation, enhanced partial discharge resistance, etc.
Problems Lots of uncertainties concerning nanocomposite applications in dielectric systems remain unanswered. The mechanisms that lead to the unique dielectric properties of nanocomposites remain unclear. Lack of understanding! especially of the underlying physics and chemistry…
Challenges Dispersion of nanoparticles in polymers. Small size = agglomeration ≠ single particles. Various preparation techniques are proposed to obviate, or at least minimise, unwanted clustering effects.
Materials Polymers: 80 wt% LDPE grade LD100BW (ExxonMobil Chemicals) 20 wt% HDPE grade Rigidex HD5813EA (BP Chemicals) Nanofiller: SiO2 nanopowder (Sigma Aldrich), 10 - 20 nm. Unfunctionalized.
Preparation of Materials Solution blending method: Nano-SiO2 was added into xylene, sonicated for 1 hour. PE blend was then added. The mixture was heated to the boiling point of xylene & stirred simultaneously. The hot mixture was precipitated in methanol. Filtering, drying and melt pressing. Unfilled PE prepared in the same way.
Thermal Analysis All nanofilled PE exhibited reduced induction time and faster crystallisation. Nanoparticles act as nucleation sites. Non-linear Avrami fitting on unfilled PE Non-linear Avrami fitting on 5 wt% nanofilled PE
Crystallisation Rate Constant, K3 At any given temperature, nanofilled PE shows higher K3. 2 wt% - increased K3. 5 wt% - higher K3 data Increased interactions? Increased nucleation sites? 10 wt% - K3 values saturated. Suppression effect caused by the reduced growth rate? Indicative of the onset of nanosilica aggregation? Plot showing the content of nano-SiO2 on K3 parameter of PE
Subsequent Melting Behaviour The melting behaviour was similar, except at Tc = 111 ºC. Pronounced double peak (unfilled PE) vs. more singular peak (nanofilled PE). Unfilled PE Nanofilled PE
Crystallinity The addition of nano-SiO2 does not affect the final crystallinity. A hint to similar melting trace? • The thickness of the lamellae is similar. • Nano-SiO2 acts as nucleating agent but does not increase the final crystallinity. • Nucleation effect + topological confinement.
Polarised Optical Microscopy For crystallised unfilled PE, spherulites can be clearly observed. For nanofilled PE: The size of the spherulites was smaller. Nano-inclusion appears dramatically to suppress spherulitic development. 0 wt% 2 wt% 10 wt% 5 wt% Crystallised at 117 ºC
Scanning Electron Microscopy Unfilled PE, crystallised 115 ºC: Open banded spherulitic structures, space filling. 2 wt% nanofilled PE: Banded spherulites can still be observed. Smaller spherulites size. Nucleation effect. Nanofiller well distributed, but agglomeration could not be avoided. 0 wt% 2 wt%
Scanning Electron Microscopy • Aggregation becomes more apparent with increasing amount of nanofiller. • At 5 wt%, the effect of spherulite banding becomes less pronounced, and the texture was significantly perturbed. • At 10 wt%, the growth of spherulite is largely suppressed, resulted in highly disordered system. 5 wt% 10 wt%
AC Breakdown Test No difference between 0 wt%, 2 wt% and 5 wt%? Severe aggregations in 10 wt% nanofilled PE reduced the breakdown strength. Crystallised at 115 ºC
AC Breakdown Test Same breakdown trend in quenched systems. Nanosilica does not alter AC breakdown strength. At severe aggregations, AC breakdown strength would be reduced. Quenched
Conclusions Nano-SiO2 enhances the nucleation density. Evidenced from the shorter crystallisation process and higher value of crystallisation rate constant. The DSC melting traces of the nanocomposites were similar to unfilled PE. Nano-SiO2 did not exert on appreciable effect on the melting behaviour. Nano-SiO2 did not possess significant effect towards the final crystallinity.
Conclusions From POM & SEM: Nano-SiO2 suppresses spherulitic development and thus perturbed the morphological structure of the isothermally crystallised material. From SEM, nanosilica is well-distributed in PE through solution blending approach. Agglomeration is unavoidable. Nano-SiO2 does not alter AC breakdown strength of PE. But the breakdown strength will reduce if the dispersion is poor.
Future Work Dielectric spectroscopy: Dielectric response of the nanocomposites. Water absorption behaviour. Pulse electro-acoustic: Space charge behaviour. Surface treatment of nano-SiO2.
Experimental Techniques DSC Perkin Elmer DSC 7 with Pyris software. Sample ~5 mg in a sealed aluminium pan. Nitrogen atmosphere. Avrami analysis was performed by DSC. Heating rate: 10 ºC min-1 Cooling rate: 100 ºC min-1 POM Linkam THM600 hot stage. Melt press sample between two microscope slides
Experimental Techniques SEM JEOL Model JSM-5910. Gun voltage = 15 kV; Working distance = 11 mm. Standard permanganic etching technique. Permanganic reagent composed of 1 % w/v solution of potassium permanganate in an acid mixture composed of concentrated sulphuric acid, phosphoric acid & water at ratio 5: 2: 1. After etching, the reagent was quenched using hydrogen peroxide & dilute sulphuric acid at ratio 4: 1.
Experimental Techniques Dielectric Breakdown Test Samples of ~85 µm in thickness were prepared by using a Specac press (150 ºC, 3 tonne). Dielectric breakdown test based upon ASTM Standard D149-87. The test sample was placed between two 6.3 mm ball-bearing electrodes immersed in silicone fluid. An AC voltage of 50 Hz and a ramp rate of 50 V(RMS) s-1 was applied until failure.
Avrami Analysis The crystallinity fraction at time t: The obtained experimental values of X and t were fitted to the equation using a non-linear approach to estimate the Kexp, ti and n. Kexp = experimental rate constant or overall crystallisation rate constant containing contributions from both nucleation and growth n = Avrami exponent or dimensionality of the growth
Crystallisation Rate Constant, K3 N = the number of nucleation sites per unit volume G = the growth rate of the crystallising objects
Crystallinity Calculation The enthalpies of melting was determined as a function of crystallisation temperature for each material and then converted into the percentage of HDPE present in each blend that was involved in each phase transition (Mandelkern, 1992). ∆H = melting enthalpy ∆Ho= the value of enthalpy corresponding to the melting of a 100 % crystalline material (293 J g-1 PE) ω = the weight fraction of the crystallisable material.
Weibull Analysis Two-parameter Weibull distribution: P(E) = cumulative probability of failure at E E = experimental breakdown strength α = scale parameter, represents the breakdown strength at the cumulative failure probability of 63.2 % β = shape parameter The cumulative probability of failure, P(E) was approximated using the median rank method: i = progressive order of failed tests n = total number of tests
SEM Micrographs “Dielectric properties of XLPE/SiO2 nanocomposites based on CIGRE WG D1.24 cooperative test results” (Tanaka et al., 2011) IEEE TDEI, 18(5), 1484-1517 XLPE containing 5wt% of functionalized nanosilica XLPE containing 5wt% of unfunctionalized nanosilica