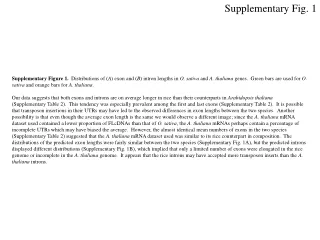
EGFR Exon Copy Number Quantification Using LCGreen in H1975 Cell Line DNA Prior to PNA-clamping PCR
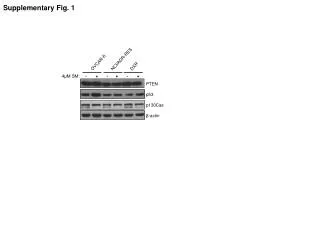
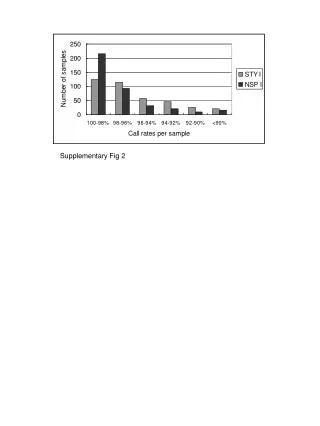
This study demonstrates the quantification of EGFR exon copy numbers in H1975 cell line DNA, including the T790M mutation, using LC-Green dye-based real-time PCR. The method involved biotin-purification, probe hybridization, and single-strand isolation. Results showed consistent recovery efficiency across samples.

EGFR Exon Copy Number Quantification Using LCGreen in H1975 Cell Line DNA Prior to PNA-clamping PCR
E N D
Presentation Transcript
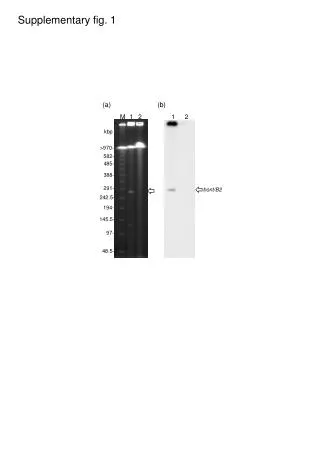
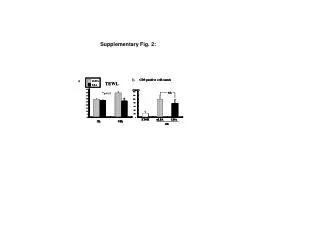
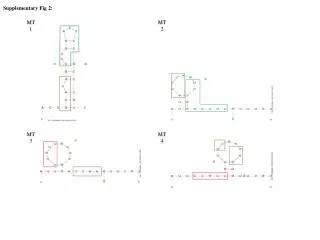
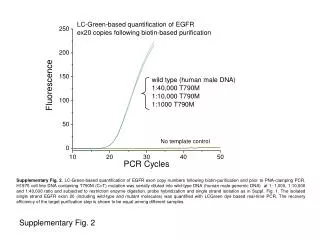
Supplementary Fig. 2. LC-Green-based quantification of EGFR exon copy numbers following biotin-purification and prior to PNA-clamping PCR. H1975 cell line DNA containing T790M (C>T) mutation was serially diluted into wild-type DNA (human male genomic DNA) at 1: 1,000, 1:10,000 and 1:40,000 ratio and subjected to restriction enzyme digestion, probe hybridization and single strand isolation as in Suppl. Fig. 1. The isolated single strand EGFR exon 20 (including wild-type and mutant molecules) was quantified with LCGreen dye based real-time PCR. The recovery efficiency of the target purification step is shown to be equal among different samples. Supplementary Fig. 2