Expression Analysis of E-cadherin and WNT Pathway Genes in Malignant Cell Lines
This study examines the relative expression ratios of E-cadherin, WNT7A, WNT10A, and ZEB1 across various treatment conditions, including control and RNA interference treatments targeting miR-200a and miR-200b. We utilized multiple cell lines, including HOC313 and TSU, to understand the regulatory mechanisms influencing epithelial-mesenchymal transition (EMT) in cancer progression. The data highlights the role of specific miRNAs in modulating the expression of key genes involved in cell adhesion and signaling pathways, providing insights into potential therapeutic targets.

Expression Analysis of E-cadherin and WNT Pathway Genes in Malignant Cell Lines
E N D
Presentation Transcript
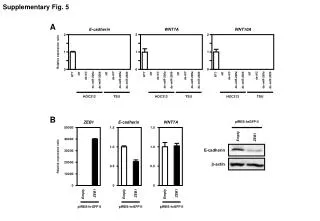
Supplementary Fig. 5 A E-cadherin WNT7A WNT10A 2 2 2 1 1 1 Relative expression ratio 0 0 0 NT NT NT NT NT NT RT7 RT7 RT7 ds-NC ds-NC ds-NC ds-NC ds-NC ds-NC ds-miR-200a ds-miR-200a ds-miR-200a ds-miR-200a ds-miR-200a ds-miR-200a ds-miR-200b ds-miR-200b ds-miR-200b ds-miR-200b ds-miR-200b ds-miR-200b HOC313 TSU HOC313 TSU HOC313 TSU B ZEB1 E-cadherin WNT7A pIRES-hrGFP II 50000 1.5 1.5 Empty ZEB1 40000 1.0 1.0 E-cadherin 30000 Relative expression ratio 20000 b-actin 0.5 0.5 10000 0 0 0 ZEB1 ZEB1 ZEB1 Empty Empty Empty pIRES-hrGFP II pIRES-hrGFP II pIRES-hrGFP II