
Uploaded by
kieran-shaffer
1 SLIDES
92 VUES
10LIKES
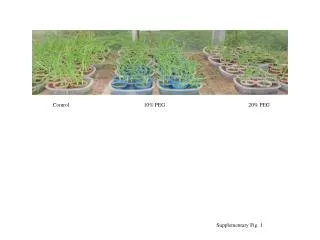
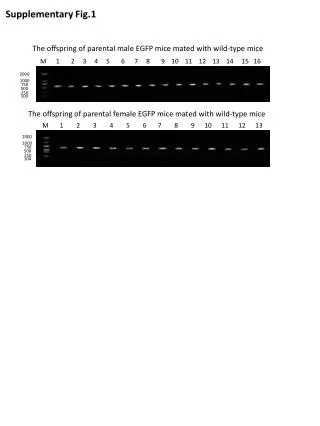
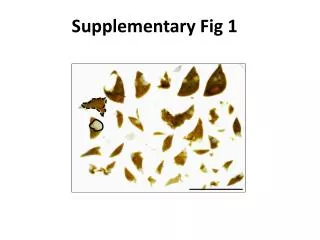
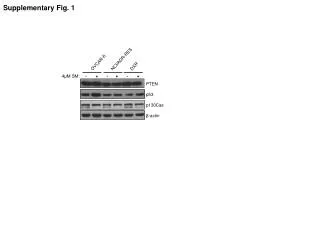
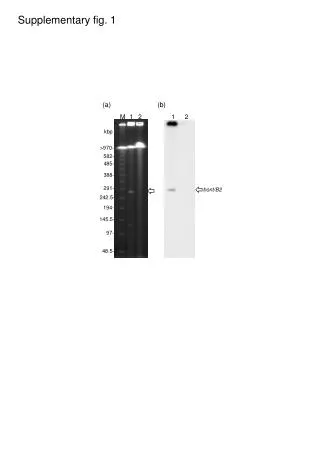
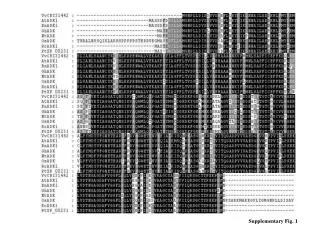
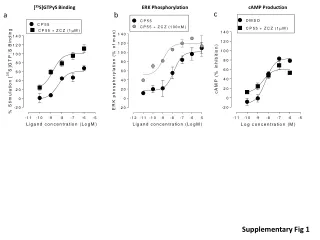
Supplementary Figure 1: PEG Control Analysis
DESCRIPTION
This supplementary figure presents data on the PEG control group, demonstrating a 10% increase in efficiency compared to the standard group in the study. Detailed analysis and comparison are provided.
Download
1 / 1
Download Presentation

Télécharger la présentation
Supplementary Figure 1: PEG Control Analysis
An Image/Link below is provided (as is) to download presentation
Download Policy: Content on the Website is provided to you AS IS for your information and personal use and may not be sold / licensed / shared on other websites without getting consent from its author.
Content is provided to you AS IS for your information and personal use only.
Download presentation by click this link.
While downloading, if for some reason you are not able to download a presentation, the publisher may have deleted the file from their server.
During download, if you can't get a presentation, the file might be deleted by the publisher.
E N D

More Related
Audio
Live Player