Impact of Chemoresistance on Disease-Free and Overall Survival: Kaplan-Meier Analysis Results
10 likes | 144 Vues
This study evaluates disease-free survival (p=0.02) and overall survival (p=0.011) differences between patients with chemosensitive and chemoresistant tumors using Kaplan-Meier analysis. Data were collected from 57 patients who underwent neoadjuvant or adjuvant chemotherapy. Chemoresistance was characterized by local relapse or distant metastases post-treatment, while chemosensitivity was marked by remaining disease-free during follow-up. The findings indicate a significant association between chemoresistance and poorer outcomes in both disease-free survival and overall survival, emphasizing the need for effective treatment strategies.

Impact of Chemoresistance on Disease-Free and Overall Survival: Kaplan-Meier Analysis Results
E N D
Presentation Transcript
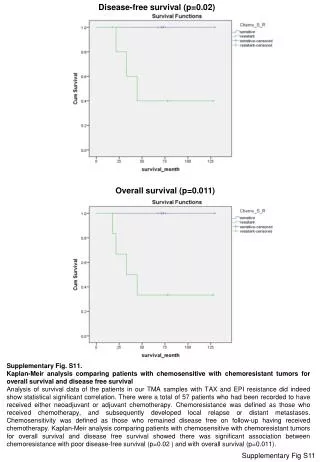
Disease-free survival (p=0.02) Overall survival (p=0.011) Supplementary Fig. S11. Kaplan-Meir analysis comparing patients with chemosensitive with chemoresistant tumors for overall survival and disease free survival Analysis of survival data of the patients in our TMA samples with TAX and EPI resistance did indeed show statistical significant correlation. There were a total of 57 patients who had been recorded to have received either neoadjuvant or adjuvant chemotherapy. Chemoresistance was defined as those who received chemotherapy, and subsequently developed local relapse or distant metastases. Chemosensitivity was defined as those who remained disease free on follow-up having received chemotherapy. Kaplan-Meir analysis comparing patients with chemosensitive with chemoresistant tumors for overall survival and disease free survival showed there was significant association between chemoresistance with poor disease-free survival (p=0.02 ) and with overall survival (p=0.011). SupplementaryFigS11