Download
1 / 1
10 likes | 74 Vues
Determining Homology of Epac1 and Epac2 Domains STEPHANIE A. BRADY † DHUNDY BASTOLA †, * †College of Information Science and Technology, University of Nebraska at Omaha, Omaha, NE 68182-0116

E N D
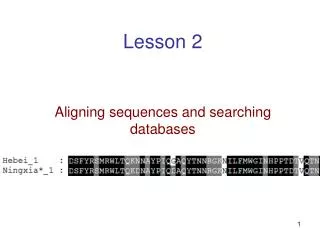
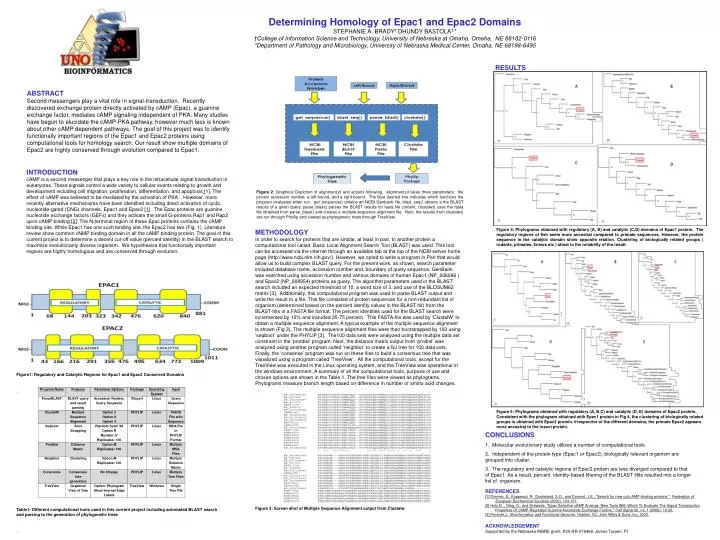
Determining Homology of Epac1 and Epac2 Domains STEPHANIE A. BRADY† DHUNDY BASTOLA†,* †College of Information Science and Technology, University of Nebraska at Omaha, Omaha, NE 68182-0116 *Department of Pathology and Microbiology, University of Nebraska Medical Center, Omaha, NE 68198-6495 RESULTS ABSTRACT Second messengers play a vital role in signal-transduction. Recently discovered exchange protein directly activated by cAMP (Epac), a guanine exchange factor, mediates cAMP signaling independent of PKA. Many studies have begun to elucidate the cAMP-PKA pathway, however much less is known about other cAMP dependent pathways. The goal of this project was to identify functionally important regions of the Epac1 and Epac2 proteins using computational tools for homology search. Our result show multiple domains of Epac2 are highly conserved through evolution compared to Epac1. INTRODUCTION cAMP is a second messenger that plays a key role in the intracellular signal transduction in eukaryotes. These signals control a wide variety to cellular events relating to growth and development including cell migration, proliferation, differentiation, and apoptosis[1]. The effect of cAMP was believed to be mediated by the activation of PKA . However, more recently alternative mechanisms have been identified including direct activation of cyclic nucleotide-gated (CNG) channels, Epac1 and Epac2 [1]. The Epac proteins are guanine nucleotide exchange factors (GEFs) and they activate the small G-proteins Rap1 and Rap2 upon cAMP binding [2]. The N-terminal region of these Epac proteins contains the cAMP binding site. While Epac1 has one such binding site, the Epac2 has two (Fig. 1). Literature review show common cNMP binding domain in all the cAMP binding protein. The goal of this current project is to determine a decent cut-off value (percent identity) in the BLAST search to maximize evolutionarily diverse organism. We hypothesize that functionally important regions are highly homologous and are conserved through evolution. Figure 2: Graphical Depiction of alignment.pl and actions following. alignment.pl takes three parameters: the protein accession number, a left bound, and a right bound. The blue dashed line indicates which functions the program evaluates when run. get_sequence() obtains an NCBI Genbank file, blast_seq() obtains a the BLAST results of a given query, parse_blast() parses the BLAST results for fasta file content, clustalw() uses the fasta file obtained from parse_blast() and creates a multiple sequence alignment file. Next, the results from clustalw() are run through Phyllip and viewed as phylogenetic trees through TreeView. Figure 4: Phylograms obtained with regulatory (A, B) and catalytic (C,D) domains of Epac1 protein. The regulatory regions of fish seem more ancestral compared to primate sequences. However, the protein sequence in the catalytic domain show opposite relation. Clustering of biologically related groups ( rodents, primates, knines etc ) attest to the reliability of the result. METHODOLOGY In order to search for proteins that are similar, at least in part, to another protein a computational tool called Basic Local Alignment Search Tool (BLAST) was used. This tool can be accessed via the internet through an available tab at the top of the NCBI server home page (http://www.ncbi.nlm.nih.gov/). However, we opted to write a program in Perl that would allow us to build complex BLAST query. For the present work, as shown, search parameter included database name, accession number and, boundary of query sequence. GenBank was searched using accession number and various domains of human Epac1 (NP_006096 ) and Epac2 (NP_008954) proteins as query. The algorithm parameters used in the BLAST search included an expected threshold of 10, a word size of 3, and use of the BLOSUM62 matrix [3]. Additionally, this computational program was used to parse BLAST output and write the result to a file. This file consisted of protein sequences for a non-redundant list of organism (determined based on the percent identity values in the BLAST hit) from the BLAST-hits in a FASTA file format. The percent identities used for the BLAST search were incremented by 10% and included 35-75 percent. This FASTA-file was used by ‘ClustalW’ to obtain a multiple sequence alignment. A typical example of the multiple sequence alignment is shown (Fig 3). The multiple sequence alignment files were then bootstrapped by 100 using ‘seqboot’ under the PHYLIP [3]. The100 data sets were analyzed using the multiple data set constraint in the ‘protdist’ program. Next, the distance matrix output from ‘prodist’ was analyzed using another program called ‘neighbor’ to create a NJ tree for 100 data sets. Finally, the ‘consense’ program was run on these files to build a consensus tree that was visualized using a program called ‘TreeView’. All the computational tools, except for the TreeView was executed in the Linux operating system, and the TreeView was operational in the windows environment. A summary of all the computational tools, purpose of use and chosen options are shown in the Table 1. The tree files were viewed as phylograms. Phylograms measure branch length based on difference in number of amino acid changes. Figure1: Regulatory and Catalytic Regions for Epac1 and Epac2 Conserved Domains . Figure 5: Phylograms obtained with regulatory (A, B,C) and catalytic (D, E) domains of Epac2 protein.Consistent with the phylogram obtained with Epac1 protein in Fig 4, the clustering of biologically related groups is obtained with Epac2 protein. Irrespective of the different domains, the primate Epac2 appears more ancestral to the insect protein. • CONCLUSIONS • Molecular evolutionary study utilizes a number of computational tools. • Independent of the protein type (Epac1 or Epac2), biologically relevant organism are grouped into cluster. • The regulatory and catalytic regions of Epac2 protein are less diverged compared to that of Epac1. As a result, percent identity-based filtering of the BLAST Hits resulted into a longer list of organism. REFERENCES [1]Dremier, S., Kopperud, R., Doskeland, S.O., and Dumont, J.E.. "Search for new cylic AMP-binding proteins." Federation of European Biochemical Societies (2003): 103-107. [2]Holz,G. , Oleg, G., and Schwede. "Epac-Selective cAMP Analogs: New Tools With Which To Evaluate The Signal Transduction Properties Of cAMP-Regulated Guanine Nucleotide Exchange Factors." Cell Signal 20, no. 1 (2008): 10-20. [3] Pevsner,J.. Bioinformatics and Functional Genomic. Hobken, NJ: John Wiley & Sons, Inc, 2003. ACKNOWLEDGEMENT Supported by the Nebraska INBRE grant, P20-RR-016469, James Turpen, PI Figure 3: Screen shot of Multiple Sequence Alignment output from Clustalw Table1: Different computational tools used in this current project including automated BLAST search and parsing to the generation of phylogenetic trees .