Download
1 / 14
140 likes | 173 Vues
Explore evaporation in reservoirs using GIS techniques with data from USGS, EPA, and NOAA. Learn about methods to estimate free-water evaporation and apply findings to dam construction planning.

E N D
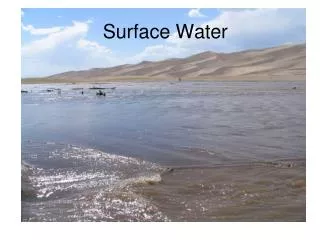
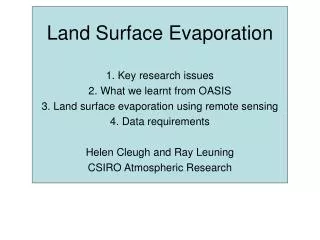
Water-Surface Evaporationin Reservoir Vitoon Thititanapak December 1999
Acknowledge Dr. David G. Tarboton Mark Winkelaar
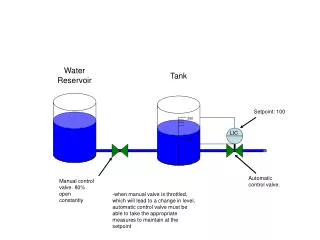
Objective • To study the effect of evaporation in reservoir. • To apply GIS technique in the analysis of the water-surface evaporation.
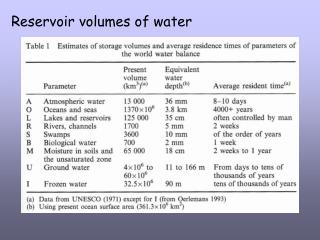
Conceptual Map • Theory Study • The role of evaporation in reservoir ( water-surface evaporation) • The method for measuring the evaporation • Data collection • DEM from USGS • RF1 from EPA • Dam site from GIS DATA DEPOT and EPA • Pan – evaporation data from • NOAA Technical Report NWS 33 • TOOL • Arc View 3.0 • SINMAP • TARDEM
Theory study 62 % of precipitation fall on the land - 97 % is evapotranspiration - 3 % is open-water evaporation Estimating Free-Water Evaporation - Water-Balance Approach - Mass-Transfer Approach - Energy-Balance Approach - Penman or Combination Approach - Pan-Evaporation Approach ( Class-A pan)
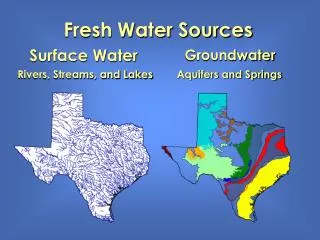
Data collection - DEM grid file from USGS http://edcwww.cr.usgs.gov/doc/edchome/ndcdb/ndcdb.html - rf1 shape file and Dam site shape file from EPA http://www.epa.gov/OST/BASIN/ - Dam location USGS digital raster graphics http://www.gisdatadepot.com/ - Pan evaporation data from NOAA technical report NWS 33
Step 1: Study area The Albers Equal-Area projection Middle Bear Basin Cutler Dam
Step 3:Locating Dam as outlet grid Newton Dam
Step 5:Calculate water-surface evaporation Evaporation = Number of cell count x cell size x pan coefficient x Class-A pan evaporation data * from National Oceanic and Atmospheric Administration Technical report, Office of Hydrology National Weather Service, June 1982 **Map 4: Map of coefficients to convert Class A pan evaporation to free water surface evaporation for May - October
Result Evaporation in Cutler Dam, Utah U.S.A. At elevation +1344.00 m Number of cell count = 13910, Cell size = 30 x 30 m.
Conclusion We can apply GIS technique to find water-surface area in reservoir at the design water level. This technique is limited on GIS data (DEM elevation grid data) to find water-surface area. This method can apply to find the reservoir area in the dam construction project planning.
THE END THANK YOU