E-TURB. RADAR – The Next “STEP”
140 likes | 373 Vues
E-TURB. RADAR – The Next “STEP”. “ S YSTEM T ECHNOLOGY E VALUATION P ROGRAM”. Prepared by Dr. Roland L. Bowles AeroTech Research (USA), Inc. Nov. 3, 2004. Outline. E- Turb. RADAR – Where are we? FY-04 ACCOMPLISHMENTS TECHNOLOGY READINESS / CURRENT STATUS

E-TURB. RADAR – The Next “STEP”
E N D
Presentation Transcript
E-TURB. RADAR – The Next “STEP” “SYSTEM TECHNOLOGY EVALUATION PROGRAM” Prepared by Dr. Roland L. Bowles AeroTech Research (USA), Inc. Nov. 3, 2004
Outline • E- Turb. RADAR – Where are we? • FY-04 ACCOMPLISHMENTS • TECHNOLOGY READINESS / CURRENT STATUS • DEMONSTRATE DISPLAY PLAYBACK & ANALYSIS SOFTWARE USING RECORDED In Service Data • SUMMARY OBSERVATIONS TO DATE
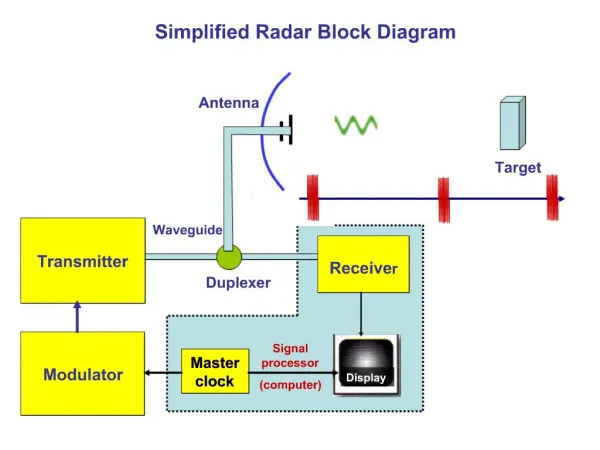
E-TURB RADAR – “STEP” Configuration “ SYSTEM TECHNOLOGY EVALUATION PROGRAM ” Delta provided B737-800 NG aircraft ROCKWELL COLLINS Radar System Installed WXR-2100 multi - scan transceiver & antenna STC’s & TSO certified Collins advanced 2nd moment detection algorithm multi - lag auto-correlation ATR provided hazard prediction algorithm & B737-800 NG hazard tables A/C weight to radar Defined hazard criteria & thresholds Fully Integrated cockpit display 2 level g - threshold “situation” display of advisory information E - TURB MODE CERTIFIED NON- INTERFERENCE WITH CURRENT WX-MODES / COCKPIT PROCEDURES
System Implementation Concept FILTERED AIRCRAFT INPUTS WEIGHT & BALANCE TRUE AIRSPEED COLLINS DETECTION ALGORITHM ALTITUDE ^ ATR HAZARD PREDICTION ALGORITHM 2nd MOMENT PRODUCT ( i,j ) “g” units TO THRESHOLD LOGIC & DISPLAYS SPATIAL / TEMPORAL FILTERING “ g” - LOAD CALCULATION B737-800 RAW DOPPLER TURBULENCE MOMENTS AIRCRAFT HAZARD
FY-04 ACCOMPLISHMENTS Key Milestones - Program Start Dec. /03 - Preliminary Design Review Mar. 3 /04 - B737-800 Hazard & Pulse Volume Mar. 3 /04 Compensation Tables Delivered * - “Ship-Set” R/T & Antenna Installed ** Mar.27/04 - B737-800 / WXR2100 STC Approval ** Mar.28/04 - Rockwell Sabreliner Flight Tests Apr.15- June 04 - Operational Readiness Review Aug.10 /04 - TSO Certification Approval Aug.14 /04 - Evaluation R/T Installed / B737-800 ** Aug.22 /04 - In- Service Operational Evaluation Aug.23 /04 – Sept. /05 - Final Report Delivered To NASA Sept.30 /05 * ATR - Rockwell Coordination ** Rockwell - Delta Coordination
E-TURB RADAR IN-SERVICE EVALUATION STATUS • SUCCESSFULY ACHIEVED SIX RADAR DATA LOGGER DOWNLOADS • 3708 OPERATIONS FOR PERIOD AUG. 23 - OCT. 26 • APPROX. 25 HOURS OF RECORDED DATA • RADAR DATA AUGMENTED BY 69 TAPS REPORTS (3708 ONLY) • DEMONSTRATED PRELIMINARY RESULTS USING Beta VERSION OF E-TURB ANALYSIS & PLAYBACK SOFTWARE • PERMITS PLAYBACK OF LOW RESOLUTION WX+T DISPLAYS ON A SCAN-BY- SCAN BASIS • ENABLES COMPARATIVE ANALYSIS OF INSITU “TRUTH” & RADAR PREDICTIVE INFORMATION • BASED ON DATA ACQUIRED TO DATE , WORK IS CURRENTLY FOCUSED ON SCORING E-TURB SYSTEM PERFORMANCE & IDENTIFYING “HIGH VALUE” CASE STUDIES FOR ANALYSIS RLB
100 80 60 40 20 0 0.05 0.1 0.15 0.2 0.25 NO. EVENTS Vs. OBSERVED RMS NORMAL ACCELERATION TURB. EVENTS* (SHIP 3708) RECORDED FOR PERIOD Aug. 23 - Sept.28 DATA SOURCE EVENT LOGGER TRIGGERS ADIRU#1 @ 50 hz. Processed Identical to Taps . PEAK ACCEL. 5 g's RMS ACCEL. .15 g's RADAR PRED. .09 g's A total of 165 events acquired from the first 4 data logger Light DISPLAY THRESHOLDS downloads. LEVEL 1 .09 g's LEVEL 2 .15 g's MANUAL TRIGGER Light to Moderate EVENTS CREW DISCRETION Note: Radar & aircraft data is recorded for each of the 165 events. Events cover all phases of flight. Moderate * 49 TAPS REPORTS FOR THE SAME PERIOD RLB INSITU TRUTH RMS LOAD g's
3.0 6 FOQA Incidents 18 ICAO Events 49 NASA EVENTS (02) 18 NASA EVENTS (00) 2.5 10 NTSB Accidents 2.0 D h UAL 747 Pacific Accident 1.5 Regression recent incident 1.0 recent incident 3708 DATA 0.5 0.0 0.0 0.1 0.2 0.3 0.4 0.5 0.6 0.7 0.8 0.9 1.0 s D h Correlation of Peak Load With Peak RMS Load ( 5 sec. window) Based on Measurements for 106 Turbulence Encounter Cases + 3708 DATA DATA SOURCES AIRCRAFT MIX / ALL FLIGHT PHASES 747 ' s 757 ' s y = 4.933e-3 +2.651x R^2 = .953 767 ' s 737 ' s L1011 ' s DC10 ' s * Cases Chosen for Detail aal 757 * Modeling to Support FAA Peak l l Radar Certification Effort NASA Flt.* g's 191 - 06 NASA R232-10 xxx 737 * FOQA light (First 4 Downloads) severe extreme light- mod. Peak g's ESTIMATED FROM RADAR OBSERVABLES FOR E-TURB. CONCEPT RLB
Evaluation Methodology E-Turb RADAR Indication of Turbulence Yes No Yes Correct Indication? Missed Indication? No Nuisance Indication? Correct Null? Corroborating Data / Information Sources: E-TURB RADAR Data / Information Sources: Qualitative Quantitative Qualitative Quantitative • ACARS Free Text Questions 1. - 5. • Crew Rept’s Not Logged On ACARS • FOQA • TAPS Rept’s, WebASD Data/ Products • NexRad/ Satellite Imagery/ Products • ACARS Free Text Question 6. • Crew Rept’s Not Logged On ACARS • Jump Seat Observer Comments (if available) • RADAR System Event/ Data Logger (auto & manual activation ) Technical Approach Corroborating Turbulence Data / Information From Non E-TURB RADAR Sources
E-Turb RADAR Evaluation Key Objectives • Establish valid data-driven answers to the four questions implied by the previous contingency table based on a case-by-case analysis using the defined turbulence data/ information sources. • A case study shall commence if and only if there is an affirmative (yes) response either from RADAR or a corroborating data/ information source. • A RADAR affirmative response shall imply exceedance of event logger triggers or display thresholds ( display paints magenta ). • If a sufficient number of cases are identified during the evaluation period, a statistical analysis shall be conducted to score overall performance / success of the E-Turb RADAR system. • Document flight operational “lessons learned” and related guidelines for improved flight safety using E-Turb technology .
Scope of Case Studies • Detailed analysis of a limited number of high value “show case events” which high-light E-Turb RADAR performance. • Tabulate and place outcomes of all admissible turbulence cases in the contingency table. • If a sufficient number of cases are identified; conduct a statistical analysis of overall radar performance and document results.
Tool Set Used For Case-by-Case Analysis • Variety of airborne radar analysis software including low resolution display playback based on radar system recorded event/data logger parameters. (RC) • 3-D wind & turbulence estimators employing FOQA data. (ATR-DAL) • TAPS reports & related data including web ASD information. (ATR) • GIS software permitting overlay of aircraft flight path on NEXRAD/SATTELITE imagery with designated event markers on path & Flt. Vis. dynamic sim. (ATR) Recorded E-Turb. RADAR Data TAPS & WebASD Products FOQA Selected High Value Case Studies ACARS Free Text Questionnaire Response WX-Info. { • E -TURB Radar Display Imagery Reconstruction. • Recovered Turbulence / Wind Time Histories. • TAPS/ web ASD Imagery ( 3708 only ). • Prevailing WX-Information. • Documented RADAR Performance & Operational “Lessons Learned.” Analysis Products
SUMMARY • Basic WXR-2100 system appears to be performing without flaw • E-Turb. functioning as per design & intended function • Based on preliminary data, evidence exists that crews are using E-Turb. to avoid indicated turbulence • Preliminary data indicates good agreement between radar predicted loads and insitu truth when avoidance is not possible • Observer feedback & Taps reports invaluable in aiding analysis • Hard work ahead to score overall WX+T system performance RLB
8 7 6 h=10 kft " h=25 kft 5 " h=40 kft " 4 3 2 1 0 100 110 120 130 140 150 160 170 180 Radar Observed 2nd. Moment Required to Achieve RMS Load= .1&.2 g's Vs. Weight B737-800 Hazard Tables & Radar Pulse Volume Compensation range = 25 nmi pulse width= 2 µsec antenna beam width= 3.8º .2g ( M2 )^.5 current SW threshold m /sec g- threshold .1 .2 over SW under warn 5 m/ s warn .1g .1g ~ indicative of ride quality boundary .2g ~ indicative of safety boundary WEIGHT klbs RLB