Download
1 / 1
10 likes | 106 Vues
cable. cable. BREAK. ROMBERG TIBURON CENTER. D. D. D. D. D. D. D. D. D. D.

E N D
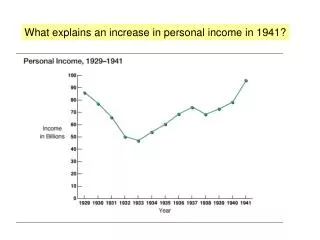
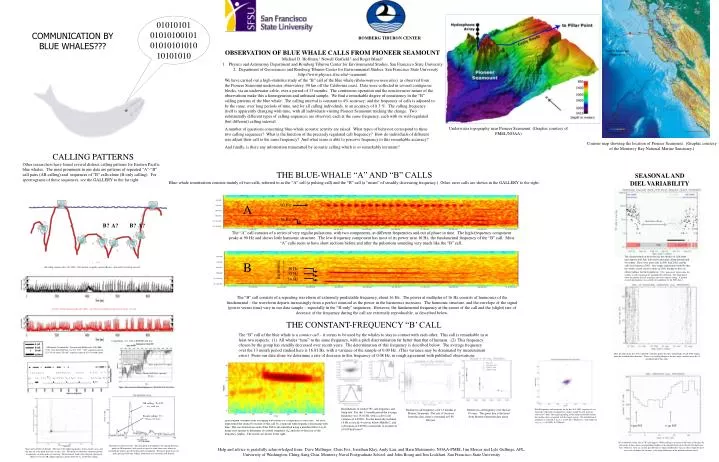
cable cable BREAK ROMBERG TIBURON CENTER D D D D D D D D D D Fitted frequency and sweep rate for the day 285, 2001 sequence of very loud calls (red points) compared to a larger sample of calls from the entire year’s data. The tighter grouping of this sample probably reflects the smaller errors associated with the larger signals. The distribution of red points is centered at (f0,) = (16.03 Hz, 0.06 Hz/sec), with widths of ( f0, ) = (0.04 Hz, 0.01 Hz/sec). AB calling sequence (day 285, 2001). Note pattern of equally spaced AB pairs, separated by breathing intervals B B B A A B A A A A A B B B A A B B A B B A B B A B B B B B B A B B B B B A B A A A A A “B-only” calling sequence (day 284, 2001). Note the closer spacing in the absence of the “A” call. Calambokidis et al., 2002, CRITTERCAM data. McDonald, Calambokidis, Teranishi and Hildebrand, JASA 109, 1728. Near Santa Barbara, Ca, Oct. 1997. “AB” sequences spaced 125-130 sec apart; “B-only” sequences spaced 45-55 seconds apart. dives spaced 500 sec apart Lunges through krill layer, spacing 80 sec Distributions in central “B”-call frequency and chirp rate. For this 13-month period the average frequency was 16.01 Hz, with a call-to-call variance of 0.09 Hz. For the musically inclined, 16 Hz is exactly 4 octaves below Middle C, and a deviation of 0.09 Hz corresponds to an interval of 0.09 half-tones!! Decline in call frequency over 13 months at Pioneer Seamount. The rate of decrease from this data alone is estimated at 0.08 Hz/year Decline in call frequency over the last 10 years. The green line is the trend from Pioneer Seamount data alone. 01010101 010101001010101010101010101010 COMMUNICATION BY BLUE WHALES??? • OBSERVATION OF BLUE WHALE CALLS FROM PIONEER SEAMOUNT • Michael D. Hoffman,1 Newell Garfield,2 and Roger Bland1 • Physics and Astronomy Department and Romberg Tiburon Center for Environmental Studies, San Francisco State University2. Department of Geosciences and Romberg Tiburon Center for Environmental Studies, San Francisco State University • http://www.physics.sfsu.edu/~seamount Pioneer Seamount Observatory We have carried out a high-statistics study of the “B” call of the blue whale (Balaenoptera musculus), as observed from the Pioneer Seamount underwater observatory, 90 km off the California coast. Data were collected in several contiguous blocks, via an underwater cable, over a period of 13 months. The continuous operation and the non-invasive nature of the observations make this a homogeneous and unbiased sample. We find a remarkable degree of consistency in the “B” calling patterns of the blue whale: The calling interval is constant to 4% accuracy; and the frequency of calls is adjusted to be the same, over long periods of time, and for all calling individuals, to an accuracy of 0.5 %. The calling frequency itself is apparently changing with time, with all individuals visiting Pioneer Seamount tracking the change. Two substantially different types of calling sequences are observed, each at the same frequency, each with its well-regulated (but different) calling interval. A number of questions concerning blue-whale acoustic activity are raised. What types of behavior correspond to these two calling sequences? What is the function of the precisely regulated call frequency? How do individuals of different size adjust their call to the same frequency? And what sense is able to perceive frequency to this remarkable accuracy? And finally, is there any information transmitted by acoustic calling which is so remarkably invariant? Underwater topography near Pioneer Seamount. (Graphic courtesy of PMEL/NOAA) Contour map showing the location of Pioneer Seamount. (Graphic courtesy of the Monterey Bay National Marine Sanctuary.) CALLING PATTERNS Other researchers have found several distinct calling patterns for Eastern Pacific blue whales. The most prominent in our data are patterns of repeated “A”-”B” call pairs (AB calling) and sequences of “B” calls alone (B-only calling). For spectrograms of these sequences, see the GALLERY to the far right. THE BLUE-WHALE “A” AND “B” CALLS Blue-whale sonorization consists mainly of two calls, referred to as the “A” call (a pulsing call) and the “B” call (a “moan” of steadily decreasing frequency.) Other, rarer calls are shown in the GALLERY to the right. SEASONAL AND DIEL VARIABILITY 125 sec 177 sec 191 sec 140 sec 136 sec 130 sec 199 sec 192 sec 128 sec 128 sec 131 sec 135 sec 139sec 137 151 138 161 227 128 149 168 190 126 131 127 238 197 128 137 242 183 143 183 183 183 183 183 183 183 183 141 140 128 133 130 138 132 132 136 130 183 183 183 183 A 90 Hz 16 Hz observatory off line B? A? B? A? The “A” call consists of a series of very regular pulsations, with two components, at different frequencies and out of phase in time. The high-frequency component peaks at 90 Hz and shows little harmonic structure. The low-frequency component has most of its power near 16 Hz, the fundamental frequency of the “B” call. Most “A” calls seem to have short sections before and after the pulsations sounding very much like the “B” call.. The clearest trends in these data are the absence of calls from mid-April to mid-July, followed by plentiful calling through mid-November. There were more calls in 2001 than 2002, and the calls were fainter in 2002. One simple explanation would be that the whales stayed closer to shore in 2002, though we have no other evidence for this hypothesis.[The ‘grayed-out’ points show the number of calls triggering the matched-filter detection. The black points show the number of calls remaining after least-squares fitting. A manual scan of spectrograms was carried out in addition for the 2002 data.] B 48 Hz harmonics 32 Hz 16 Hz The “B” call consists of a repeating waveform of extremely predictable frequency, about 16 Hz. The power at multiples of 16 Hz consists of harmonics of the fundamental – the waveform departs increasingly from a perfect sinusoid as the power in the harmonics increases. The harmonic structure, and the envelope of the signal (power versus time) vary in our data sample – especially in the “B-only” sequences. However, the fundamental frequency at the center of the call and the (slight) rate of decrease of the frequency during the call are extremely reproducible, as described below. THE CONSTANT-FREQUENCY “B’ CALL The “B” call of the blue whale is a contact call – it seems to be used by the whales to stay in contact with each other. This call is remarkable in at least two respects. (1) All whales “tune” to the same frequency, with a pitch discrimination far better than that of humans. (2) This frequency chosen by the group has steadily decreased over recent years. The determination of this frequency is described below. The average frequency over the 13 month period studied here is 16.01 Hz, with a variance of the sample of 0.09 Hz. (This variance may be dominated by measurement error.) From our data alone we determine a rate of decrease in this frequency of 0.08 Hz, in rough agreement with published observations. Here the hour of the day (UT) is plotted vertically against the date, horizontally, for all 6984 triggers from the matched-filter detection. There is no striking change in the day-night variation over the 13-month period of this study. AB calling: T= 128 sec, =8 sec B-only calling: T = 50 sec, =3 sec Spectrogram obtained from averaging waveforms for a sequence of loud calls. We have represented the central 6 seconds of this call by a sinusoid with frequency decreasing with time. The waveform from each of the 6984 calls identified using a matched filter was fit using least squares to determine its central frequency (f0) and rate of decrease of the frequency (alpha). The results are shown to the right. 6 pm PST 6 am PST Diel variability of the rate of “B” call triggers. While calling is observed at all hours of the day, the plot peaks in those hours corresponding roughly to the daylight hours in the Pacific Daylight time zone. However, there are various possible biases which could lead to such an effect which we have not so far excluded (for instance, a day-night difference in the ambient acoustic noise). Histogram of time intervals. The main peak corresponds to the spacing between peaks in AB sequences, with a peak at twice its value from cases where an intermediate peak is missed by the pattern recognition. The lower peak shows the peak spacing for B-only calling. Both times are extremely well defined. Help and advice is gratefully acknowledged from: Dave Mellinger, Chris Fox, Jonathan Klay, Andy Lau, and Haru Matsumoto, NOAA-PMEL Jim Mercer and Lyle Gullings, APL, University of Washington; Ching-Sang Chiu, Monterey Naval Postgraduate School; and John Bourg and Jim Lockhart, San Francisco State University Time interval between B calls. The time to the following peak is shown on the x axis, and the time on to the peak after that, on the y axis. The peaks are found by automatic pattern recognition, so many peaks are missing. The prominent bands show the peak spacing of about 125 sec for AB calling sequences and of about 50 sec, for B-only calling.