Download
1 / 2
20 likes | 176 Vues
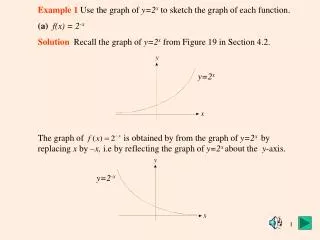
Example 1 Use the graph of y=2 x to sketch the graph of each function. (a) f(x) = 2 -x Solution Recall the graph of y=2 x from Figure 19 in Section 4.2.

E N D
Example 1 Use the graph of y=2xto sketch the graph of each function. (a)f(x) = 2-x Solution Recall the graph of y=2xfrom Figure 19 in Section 4.2. The graph of is obtained by from the graph of y=2x by replacing x by –x, i.e by reflecting the graph of y=2x about the y-axis. y=2x y=2-x
Solution Observe that g(-x) = g(x) and g is an even function. The graph of g for x>0 is obtained from the graph of y=2xby increasing the y-coordinate of each point, i.e. the graph of g rises faster than the graph of y=2x. The graph of g for x<0 is obtained by reflecting the graph of g for x > 0 about the y-axis. See the left diagram below. Solution Since the graph of h is obtained by reflecting the graph of g about the blue line y=1 and compressing the resulting curve to keep it between the x-axis and the line y=1. See the right diagram above. y=2x