Download
1 / 6
60 likes | 84 Vues
The present investigation was carried out to study area, production and productivity trends and growth rates of maize (Zea mays) crop grown in Panchmahal region of Gujarat state, India for the period 1949-50 to 2007-08 based on parametric and nonparametric regression models. In parametric models different linear, non-linear and time-series models were employed. The statistically most suited parametric models were selected on the basis of adjusted R2, significant regression co-efficient and co-efficient of determination (R2). Appropriate time-series models were fitted after judging the data for stationarity. The statistically appropriate model was selected on the basis of various goodness of fit criteria viz. Akaike's Information Criterion, Bayesian Information Criterion, RMSE, MAE , assumptions of normality andindependence of residuals. In nonparametric regression optimum bandwidth was computed by cross-validation method. 'u02dcEpanechnikov-kernel' was used as the weight function. Nonparametric estimates of underlying growth function were computed at each and every time point. Residual analysis was carried out to test the randomness. Relative growth rates of area, production and productivity were estimated based on the best fitted trend function. Linear model was found suitable to fit the trends in area and production of maize crop whereas for the productivity nonparametric regression without jump-point emerged as the best fitted trend function. The compound growth rate values obtained for the years (1949-50 to 2007-08) in area, production and productivity of the maize crop showed that the production had increased at a rate of 0.49 per cent per annum due to combined effect of increase in area and productivity at a rate of 0.30 and 0.21 per cent per annum respectively. R.S. Parmar | S.H. Bhojani | G.B.Chaudhari"Application of Regression Models for Area, Production and Productivity Trends of Maize (Zea mays) Crop for Panchmahal Region of Gujarat State, India" Published in International Journal of Trend in Scientific Research and Development (ijtsrd), ISSN: 2456-6470, Volume-1 | Issue-3 , April 2017, URL: http://www.ijtsrd.com/papers/ijtsrd71.pdf http://www.ijtsrd.com/other-scientific-research-area/other/71/application-of-regression-models-for-area-production-and-productivity-trends-of-maize-zea-mays-crop-for-panchmahal-region-of-gujarat-state-india/rs-parmar<br>

E N D
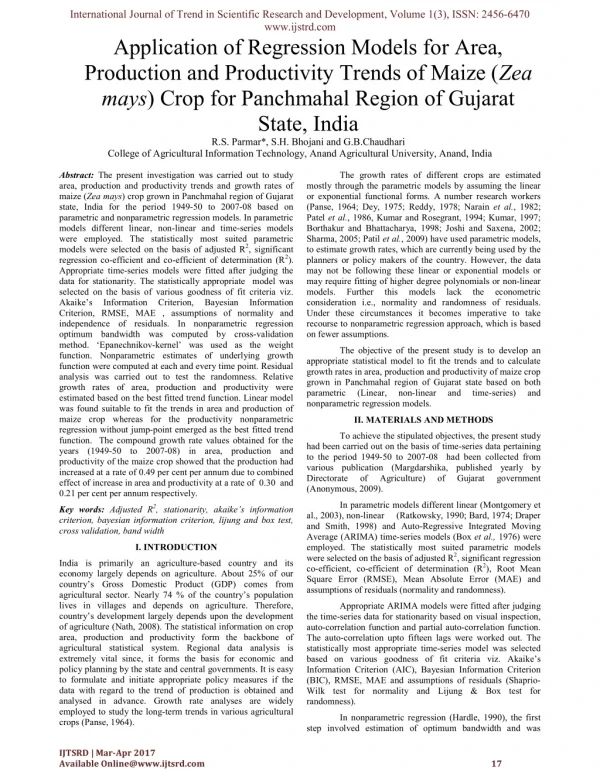
International Journal of Trend in Scientific Research and Development, Volume 1(3), ISSN: 2456-6470 www.ijstrd.com Application of Regression Models for Area, Production and Productivity Trends of Maize (Zea mays) Crop for Panchmahal Region of Gujarat State, India R.S. Parmar*, S.H. Bhojani and G.B.Chaudhari College of Agricultural Information Technology, Anand Agricultural University, Anand, India Abstract: The present investigation was carried out to study area, production and productivity trends and growth rates of maize (Zea mays) crop grown in Panchmahal region of Gujarat state, India for the period 1949-50 to 2007-08 based on parametric and nonparametric regression models. In parametric models different linear, non-linear and time-series models were employed. The statistically most suited parametric models were selected on the basis of adjusted R2, significant regression co-efficient and co-efficient of determination (R2). Appropriate time-series models were fitted after judging the data for stationarity. The statistically appropriate model was selected on the basis of various goodness of fit criteria viz. Akaike’s Information Criterion, Bayesian Information Criterion, RMSE, MAE , assumptions of normality and independence of residuals. In nonparametric regression optimum bandwidth was computed by cross-validation method. ‘Epanechnikov-kernel’ was used as the weight function. Nonparametric estimates of underlying growth function were computed at each and every time point. Residual analysis was carried out to test the randomness. Relative growth rates of area, production and productivity were estimated based on the best fitted trend function. Linear model was found suitable to fit the trends in area and production of maize crop whereas for the productivity nonparametric regression without jump-point emerged as the best fitted trend function. The compound growth rate values obtained for the years (1949-50 to 2007-08) in area, production and productivity of the maize crop showed that the production had increased at a rate of 0.49 per cent per annum due to combined effect of increase in area and productivity at a rate of 0.30 and 0.21 per cent per annum respectively. Key words: Adjusted R2, stationarity, akaike’s information criterion, bayesian information criterion, lijung and box test, cross validation, band width mostly through the parametric models by assuming the linear or exponential functional forms. A number research workers (Panse, 1964; Dey, 1975; Reddy, 1978; Narain et al., 1982; Patel et al., 1986, Kumar and Rosegrant, 1994; Kumar, 1997; Borthakur and Bhattacharya, 1998; Joshi and Saxena, 2002; Sharma, 2005; Patil et al., 2009) have used parametric models, to estimate growth rates, which are currently being used by the planners or policy makers of the country. However, the data may not be following these linear or exponential models or may require fitting of higher degree polynomials or non-linear models. Further this models consideration i.e., normality and randomness of residuals. Under these circumstances it becomes imperative to take recourse to nonparametric regression approach, which is based on fewer assumptions. The growth rates of different crops are estimated lack the econometric appropriate statistical model to fit the trends and to calculate growth rates in area, production and productivity of maize crop grown in Panchmahal region of Gujarat state based on both parametric (Linear, non-linear nonparametric regression models. The objective of the present study is to develop an and time-series) and II. MATERIALS AND METHODS To achieve the stipulated objectives, the present study had been carried out on the basis of time-series data pertaining to the period 1949-50 to 2007-08 had been collected from various publication (Margdarshika, published yearly by Directorate of Agriculture) (Anonymous, 2009). of Gujarat government In parametric models different linear (Montgomery et al., 2003), non-linear (Ratkowsky, 1990; Bard, 1974; Draper and Smith, 1998) and Auto-Regressive Integrated Moving Average (ARIMA) time-series models (Boxet al., 1976) were employed. The statistically most suited parametric models were selected on the basis of adjusted R2, significant regression co-efficient, co-efficient of determination (R2), Root Mean Square Error (RMSE), Mean Absolute Error (MAE) and assumptions of residuals (normality and randomness). I. INTRODUCTION India is primarily an agriculture-based country and its economy largely depends on agriculture. About 25% of our country’s Gross Domestic Product (GDP) comes from agricultural sector. Nearly 74 % of the country’s population lives in villages and depends on agriculture. Therefore, country’s development largely depends upon the development of agriculture (Nath, 2008). The statistical information on crop area, production and productivity form the backbone of agricultural statistical system. Regional data analysis is extremely vital since, it forms the basis for economic and policy planning by the state and central governments. It is easy to formulate and initiate appropriate policy measures if the data with regard to the trend of production is obtained and analysed in advance. Growth rate analyses are widely employed to study the long-term trends in various agricultural crops (Panse, 1964). Appropriate ARIMA models were fitted after judging the time-series data for stationarity based on visual inspection, auto-correlation function and partial auto-correlation function. The auto-correlation upto fifteen lags were worked out. The statistically most appropriate time-series model was selected based on various goodness of fit criteria viz. Akaike’s Information Criterion (AIC), Bayesian Information Criterion (BIC), RMSE, MAE and assumptions of residuals (Shaprio- Wilk test for normality and Lijung & Box test for randomness). In nonparametric regression (Hardle, 1990), the first step involved estimation of optimum bandwidth and was IJTSRD | Mar-Apr 2017 Available Online@www.ijtsrd.com 17
International Journal of Trend in Scientific Research and Development, Volume 1(3), ISSN: 2456-6470 www.ijstrd.com computed by cross-validation method. ‘Epanechnikov-kernel’ was used as the weight function. Nonparametric estimates of underlying growth function were computed at each time point. Residual analysis was carried out to test the randomness. A relative growth rate was calculated based on best fitted model. (613.20) errors in comparison to that of other linear and non- linear models. Since all the partial regression co-efficient was highly significant and Shapiro-Wilks test and run test values were non-significant, this model fulfilled model selection criteria. The following model was found suitable to fit the trend in production of maize crop. III. RESULTS AND DISCUSSION Y = 869.85** + 27.54** X (R2 = 27** %) Different linear, non-linear and nonparametric regression models were employed to study the trends in area, production and productivity of maize crop. Data obtained for Panchmahal district of middle Gujarat were employed. The characteristics of fitted linear, non-linear (Tables 1, 2. and 3) and time-series (Table 4) models are presented. The findings are discussed in sequence as under. Trends in production, based on time-series models: In ARIMA time-series methodology the auto- correlation upto fifteen lags was worked out. Since the computed auto-correlations k values did not tail off towards zero, the original series was found to be non-stationary. The non-stationarity was also confirmed by examining the realization visually. It was found that the mean and variance were changing over the time. However, the stationarity was achieved by differencing one time i.e., d=1. The pattern of auto-correlations k showed damped sine-wave and significant partial auto-correlations kk at third, fourth and fifth lags. This suggested consideration of ARIMA(3,1,0), ARIMA(4,1,0) and ARIMA(5,1,0) as the candidate models and the results are given in Table 4. But the values of AIC (954.14), BIC (966.51), RMSE (851.72) and MAE (634.31) were minimum in ARIMA(5,1,0) model in comparison to that of other candidate model. Also the model ARIMA(5,1,0) fulfilled the model selection criteria and hence the model ARIMA(5,1,0) was found suitable to fit the trend in production of maize crop among the ARIMA families’ of time-series models. Trends in area, based on linear and non-linear models: The data presented in Table 1 for area under the maize crop revealed that among the linear and non-linear models fitted for area under the maize crop, the maximum adjusted R2 of 91 per cent was observed in case of third degree polynomial model and since the run test value was found to be significant, this model failed to fulfill the model selection criteria. The quadratic, exponential and Gompertz models also failed to fulfill the model selection criteria. The linear model with the maximum of 85 per cent adjusted R2 with the comparatively lower values of RMSE (120.60) and MAE (87.86) was found suitable to fit the trends in area under the cotton crop. Y= 1069.76** + 17.19** X ( R2 = 85** %) Trends in production, based on nonparametric regression model: Trends in area, based on time-series models: In ARIMA time-series methodology the auto- correlation upto fourteen lags was worked out. Since the computed auto-correlations k values did not tail off towards zero, the original series was found to be non-stationary. The non-stationarity was also confirmed by examining the realization visually. It was found that the mean and variance were changing over the time. However, the stationarity was achieved by differencing two times i.e., d=2. The pattern of auto-correlations k showed damped sine-wave and significant partial auto-correlations kk at second and third lags. This suggested consideration of ARIMA(2,2,0) and ARIMA(3,2,0) as the candidate models and the results are given in Table 4. Since the Shapiro-Wilks test was significant in both the models, these models have failed to fulfill the model selection criteria. Hence none of the ARIMA families’ of time-series models were found suitable to fit the trend in area under the maize crop. Nonparametric regression model could not be fitted in case of production of maize crop due to over smoothing. Since the RMSE (767.52) and MAE (613.20) values in linear model were minimum in comparison to those in ARIMA (5,1,0), the linear model was found suitable to fit the trend in production of maize crop. The graph of the fitted trend for production of maize crop using linear model is depicted in the Fig.2. Trends in productivity, based on linear and non-linear models: The data presented in Table 3 for productivity of maize crop revealed that among the linear and non-linear models fitted, the adjusted R2 ranges from 01 to 05 per cent. These values were too low to fit the trends in productivity of maize crop. This might be due to very larger variability in yield of maize crop. None of the linear and non-linear model was found suitable to fit the trends in productivity of maize crop. Trends in area, based on nonparametric regression model: Trends in productivity, based on time-series models: Nonparametric regression could not be fitted to the area under the maize crop due to over smoothing. As per the model selection criteria linear model was selected as the best fitted model to fit the trends in area under the maize crop. The graph of the fitted trends in maize crop using linear model is depicted in the Fig.1. None of the ARIMA families’ time-series models was found suitable to fit the productivity trend in maize crop. Trends in productivity, based on nonparametric regression model: For the productivity data of maize crop the optimum bandwidth was computed as 0.07 using the cross-validation method. Nonparametric estimates of underlying growth function were computed at each and every point. Residual analysis showed that the assumptions of independence of errors were not violated at 5% level of significance. The root mean square and mean absolute errors values were found to be 425.80 and 360.35 respectively. The nonparametric regression Trends in production, based on linear and non-linear models: The data presented in Table 2 for production of maize crop revealed that among the linear and non-linear models fitted, the maximum adjusted R2 of 26 per cent was observed in case of linear model and this model showed comparatively lower values of root mean square (767.52) and mean absolute IJTSRD | Mar-Apr 2017 Available Online@www.ijtsrd.com 18
International Journal of Trend in Scientific Research and Development, Volume 1(3), ISSN: 2456-6470 www.ijstrd.com model was selected as the best fitted trend function for the productivity trend of the maize crop. No significant jump-point was observed in the productivity of maize crop. The graph of the fitted trend for the productivity of maize crop using the nonparametric regression is depicted in the Fig.3. Discussion in area, production and productivity of paddy crop: Yadav and Das (1990) and Bera et al., (2002) used exponential model to study the trends in area, production and productivity of maize in Assam for the periods from 1966 – 67 to 1985 – 86 and in major maize growing districts of West Bengal respectively. In the present study exponential model could not be emerged as the best fitted model because of lack of assumptions of residuals. The linear model emerged as the best fitted trend model for area and production of maize crop. Nonparametric regression was used to fit the trends in productivity of maize crop Growth rates in area, production and productivity of paddy crop: The compound growth rate values obtained for the years (1949-50 to 2007-08) in area, production and productivity of the maize crop showed that the production had increased at a rate of 1.82 per cent per annum which might be due to combined effect of increase in area and productivity at a rate of 1.12 and 0.77 per cent per annum respectively. Growth rate of area, production and productivity of maize crop were depicted in Fig.4. 2 1.8 1.6 ates 1.4 1.2 th R 1 row 0.8 0.6 . G 0.4 0.2 0 Area Production Productivity Figure 4: Compound Growth Rates of area, production and productivity of maize crop IJTSRD | Mar-Apr 2017 Available Online@www.ijtsrd.com 19
International Journal of Trend in Scientific Research and Development, Volume 1(1), ISSN: XXXX-XXXX www.ijtrd.com Table 1: Characteristics of fitted linear and non-linear models for area of maize crop (Panchmahal) Regression Coefficients Goodness of fit Model R2 / Adj.R2 Shapiro – Wilks test 0.087 Run Test RMSE MAE A B C D 1069.76** (32.36) 1213.59** (43.13) 1085.15** (54.25) 1128.89** (20.32) 52572.40* (1099933.99) 672712.92* (14618521.75) 17.19** (0.938) 3.04 (3.32) 27.70** (7.76) 0.0107** (0.000522) 51503.84* (1099895.94) 1.86* (3.39) 0.85** [0.85] 0.89** [0.89] 0.91** [0.91] 0.88** [0.88] 0.85* [0.84] 0.88** [0.88] Linear - - 0.059 120.60 87.86 0.2358** (0.0536) -0.7831** (0.2993) - Quadratic - 0.006 0.088 103.96 74.89 0.0113** (0.0033) - Cubic 0.237 0.006 94.26 71.24 Exponential 0.016 0.049 110.47 79.87 0.000337* (0.00726) 0.0018* (0.0066) Monomolecular - 0.086 0.049 120.98 88.08 Gompertz Relation - 0.041 0.013 111.26 81.95 Table 2: Characteristics of fitted linear and non-linear models for production of maize crop (Panchmahal) Regression Coefficients B Goodness of fit Shapiro – Wilks test 0.879 R2 / Adj.R2 Model A C D Run Test RMSE MAE 869.85** (205.93) 931.34** (318.24) 767.15 (440.30) 891.49** (136.01) 39924.91* (1529527.82) 21941.16* (257639.72) 794.67* (414.62) 6852.00* (27419.49) 27.54** (5.97) 21.49 (24.47) 53.01 (63.02) 0.0158** (0.0044) 39060.56* (1529286.32) 1.1419* (3.67) 1.012* (0.0010) 6.085* (26.99) 0.27** [0.26] 0.27** [0.25] 0.28** [0.24] 0.18** [0.17] 0.27* [0.25] 0.27* [0.24] 0.28* [0.25] 0.27* [0.24] Linear - - 0.894 767.52 613.20 Quadratic 0.1008 (0.3954) -1.2016 (2.4296) - - 0.846 0.897 767.07 612.29 Cubic 0.0145 (0.0266) - 0.773 0.897 765.02 610.67 Exponential 0.987 0.897 799.18 652.41 0.00071* (0.0287) 0.0064* (0.0298) 0.1171* (0.2410) 0.0220* (0.0311) Monomolecular - 0.883 0.894 768.00 614.00 Gompertz Relation Hoerl - 0.841 0.359 767.12 611.92 - 0.840 0.897 765.56 611.31 Logistic - 0.840 0.359 767.18 611.81 * Significant at 5% level Values in brackets ( ) indicate standard errors Adjusted R2 Table 3: Characteristics of fitted linear and non-linear models for productivity of maize crop (Panchmahal) ** Significant at 1% level Values in square brackets [ ] indicate Regression Coefficients B Goodness of fit Run Test R2 / Adj.R2 Model A C D Shapiro – Wilks test 0.115 RMSE MAE 856.18** (115.67) 744.03** (177.76) 658.22** (246.03) 789.71** (116.06) 1110.00* (75.56) 1105.15* (70.89) 1102.25* Linear 6.25 (3.35) 17.27 (13.67) 33.75 (35.21) 0.0051 (0.0043) 667.85* (408.03) -0.1087* (0.8614) 1.37* - - 0.06 [0.04] 0.07 [0.04] 0.07 [0.02] 0.02 [0.01] 0.08* [0.05] 0.08* [0.05] 0.08* 0.695 431.12 361.77 Quadratic -0.1839 (0.2208) -0.8646 (1.3576) - - 0.111 0.897 428.47 361.49 Cubic 0.0076 (0.0149) - 0.109 0.897 427.47 359.70 Exponential 0.150 0.695 448.39 386.93 0.156* (0.146) 0.2039* (0.1897) 0.2516* Monomolecular - 0.122 0.894 425.51 358.50 Gompertz Relation Logistic - 0.143 0.894 422.39 358.28 - 0.161 0.510 425.30 358.23 IJTSRD | Sep-Oct 2016 Available Online@www.ijtsrd.com 20
International Journal of Trend in Scientific Research and Development, Volume 1(1), ISSN: XXXX-XXXX www.ijtrd.com (68.51) (1.58) (0.2367) Hoerl 594.71* (231.59) (0.0086) (0.1903) Morgan- Mercer-Flodin (415.76) (477.44) (92.43) (3.83) Table 4: Characteristics of fitted time-series models for area, production and productivity of Maize (Panchmahal) [0.05] 0.08* [0.05] 0.09* [0.04] 0.9965* 0.2106* - 0.098 0.897 426.02 359.23 541.80* 1110.48* 2.37* 58.50* 0.157 0.894 424.63 357.32 Aspects ARIMA (p,d,q) Constant Auto-regressive Co-efficient 2 3 Goodness of Fit Shapiro – Wilks test 0.001 1 4 5 6 AIC / BIC Box – Ljung RMSE/ MAE Area (2,2,0) -0.868 (6.840) -1.051 ** (0.129) -1.108 ** (0.139) -0.669 ** (0.128) -0.732 ** (0.134) -0.804 ** (0.127) - -0.414 ** (0.124) -0.592 ** (0.188) -0.376 * (0.150) -0.471 ** (0.162) -0.683 ** (0.170) - - - - - 716.80 / 722.93 717.14 / 725.32 959.83 / 968.07 959.65 / 969.96 954.14 / 966.51 - 8.48 [21.02] 140.39 / 97.41 (3,2,0) -0.918 (5.821) -0.189 (0.137) - - - 0.001 9.32 [19.67] 140.07 / 94.83 Production (3,1,0) 21.333 (50.832) -0.352 * (0.136) -0.469 ** (0.158) -0.689 ** (0.168) - - - - 0.411 10.60 [19.67] 914.09 687.80 (4,1,0) 22.925 (42.011) -0.212 (0.149) - - 0.137 9.94 [18.30] 904.55 / 685.52 851.72 / 634.31 - (5,1,0) 28.103 (28.263) -0.499 ** (0.176) - -0.399 ** (0.152) - - 0.501 5.65 [16.91] Productivity ** estimated t – values are greater than or equal to 2 Values in the brackets () are corresponding standard errors Values in the square brackets [ ] indicate critical values for Chi – square statistic at 5 % level of significance - - - - - 3000 Y = 1069.80**+17.19**X R2= 0.85 2500 2000 1500 Area '00 ha 1000 500 0 1 3 5 7 9 11131517192123252729313335373941434547495153555759 Year Observed Figure 1: Trends in area of maize crop based on first degree polynomial model 5000 y = 869.85**+ 27.535**X R2= 0.27 4000 3000 Production '00 MT 2000 1000 0 1 3 5 7 9 11131517192123252729313335373941434547495153555759 Year Observed Figure 2: Trends in production of maize crop based on first degree polynomial IJTSRD | Sep-Oct 2016 Available Online@www.ijtsrd.com 21
International Journal of Trend in Scientific Research and Development, Volume 1(1), ISSN: XXXX-XXXX www.ijtrd.com 2500 2000 1500 Area '00 ha 1000 500 0 1 3 5 7 911131517192123252729313335373941434547495153555759 Year Obser… Figure 3: Trends in Productivity of Maize Crop Based On Nonparametric Regression CONCLUSION 11.Kumar, P. (1997). Food security: Supply and demand perspective. Indian Farming, 12:4-9. 12.Montgomery, D. C., Peck, E. A. and Vining, G. G. (2003). Introduction to Linear Regression Analysis. John Wiley & sons, Inc. 13.Narain, P., Pandey, R. K. and Sarup, S. (1982). Perspective plan for food grains. Commerce, 145:184-191. 14.Nath, S. K. (2008). Manual on area and crop production statistics. Central Statistical Organisation. 15.Panse, V. G. (1964). Yield trends of rice and wheat in first two five-year plans in India. J. Ind. Soc. Agril. Statist., 16:1–50. 16.Patel, R.H., Patel, G.N. and Patel, J.B. (1986). Trends and varia 17.Patil, B. N., Bhonde, S. R. and Khandikar, D. N. (2009). Trends in area, production and productivity of groundnut in Maharashtra. Financing Agriculture, March-April:35- 39. 18.Ratkowsky, D. A. (1990). Handbook of Non-linear Regression Models. Marcel Dekker, New York. 19.Reddy, V. N. (1978). Growth rates. Economic and Political weekly,13:806–812. 20.Sharma, M. (2005). Study on agricultural growth performance of Assam. Economic Affairs,50(1):38-41. 21.Yadav, C. P. and Das, L. C. (1990). Growth trend of rice in Assam. Economic Affairs, 35(1):15-21. Linear model was found suitable to fit the trends in area and production of maize crop whereas for the productivity nonparametric regression without jump-point emerged as the best fitted trend function. The compound growth rate values obtained for the years (1949-50 to 2007-08) in area, production and productivity of the maize crop showed that the production had increased at a rate of 0.49 per cent per annum due to combined effect of increase in area and productivity at a rate of 0.30 and 0.21 per cent per annum respectively. Acknowledgement I feel great pleasure in expressing my deep sense of respect and profound gratitude to my dearest friend Dr. A. Rajarathinam, Professor, Manonmaniam Sundaranar University, Tirunelveli, Tamil Nadu for his learned counsels and meticulous guidance from the conception to the logical end of this arduous task. Department of Statistics, References 1.Anonymous (2009). Districtwise area, production and productivity per hectare of important food and non-food crops in Gujarat, Directorate of Agriculture, Gujarat, Krishi Bhavan, Gandhinagar. 2.Bard, Y. (1974). Nonlinear Parameter Estimation. Academic Press: New York. 3.Bera, M. K., Chakravarty, K. Md. Shahjahan and Nandi, S. (2002). Area, production and productivity of rice in major rice growing districts of West Bengal during nineteen eighties. Economic Affairs,47(2):108-114. 4.Borthakur, S and Bhattacharya, B. K. (1998). Trend analysis of area, production and productivity of potato in Assam : 1951–1993. Economic Affairs, 43(4):221-226. 5.Box, G. E. P. and Jenkins, G. M. (1976). Time Series Analysis : Forecasting and Control, Second Edition, Holden Day. 6.Dey, A.K. (1975). Rates of growth of agriculture and industry. Econ. Political Weekly, 10 : A26-A30. 7.Draper, N. R. and Smith, H. (1998). Applied Regression Analysis, 3rd Edn., John and Wiley & Sons, USA. 8.Hardle, W. (1990). Applied Non-parametric Regression. Cambridge Univ. Press. 9.Joshi, P.K. and Saxena, R. (2002). A profile of pulses production in India: Facts, trends and opportunities. Ind. J. Agric. Econ., 57:326-339. 10.Kumar, P. and Rosegrant, M.W. (1994). Productivity and sources of growth for rice in India. Econ. Political Weekly, 29 : 183-188. IJTSRD | Sep-Oct 2016 Available Online@www.ijtsrd.com 22


![LS6K1 [ Lilium longiflorum ]](https://cdn1.slideserve.com/3565649/slide1-dt.jpg)