
Figures
E N D
Presentation Transcript
Expanding lipidome coverage using LC-MS/MS data-dependent acquisition with automated exclusion list generationSupporting Information Jeremy P. Koelmel1, Nicholas M. Kroeger2, Emily L. Gill1, Candice Z. Ulmer1,3, John A. Bowden3, Rainey E. Patterson1, Richard A. Yost1,4, Timothy J. Garrett1,4* 1University of Florida, Department of Chemistry, 214 Leigh Hall, Gainesville, Florida 32611, United States 2University of Florida, College of Engineering, 412 Newell Dr, Gainesville, Florida 32611, United States 3National Institute of Standards and Technology, Hollings Marine Laboratory, 331 Ft. Johnson Road, Charleston, SC 29412, United States 4University of Florida, Department of Pathology, Immunology, and Laboratory Medicine, College of Medicine, 1600 SW Archer Rd, Gainesville, Florida 32603, United States *tgarrett@ufl.edu
a) Red Cross plasma b) Substantia nigra tissue Figure S-1: Distribution of chromatographic peaks determined by MZmine full widths at half maximum (FWHM) for Red Cross plasma in positive and negative polarity (a) and Substantia nigra in positive and negative polarity (b). The retention time window for both determining the MS/MS scan under a chromatographic feature and for exclusion of ions previously selected, was 0.3 min, which wasclose to the median of FWHM values.
a) Without IE b) With IE Figure S-2: Selected precursor ions m/z and retention times for 6 repetitive injections using the traditional ddMS2 approach (a) and iterative based-exclusion ddMS2 (IE-ddMS2) (b) for substantia nigra lipid extracts analyzed in positive mode. The higher density of selected precursor ions in (b) highlights theselection of precursor ions using IE which were not fragmented using the traditional ddMS2 approach.
a) GPL region without IE b) GPL regionwith IE Figure S-3: Selected precursor ions m/z and retention times for 6 repetitive injections using the traditional ddMS2 approach (a) and iterative based-exclusion ddMS2 (IE-ddMS2) (b) for substantia nigra lipid extracts analyzed in positive mode, zoomed into the glycerophospholipid (GPL) region. Identified lipid molecules by LipidMatch are also shown without IE (c) and with IE (d).
a) Plasma positive b) Plasma negative Figure S-4: Cumulative unique lipid molecular identifications using LipidSearch software across multiple data acquisitions. Iterative exclusion-based data-dependent top5 (IE-ddMS2-top5) described in this paper is compared with with traditional ddMS2 top5 for lipid extracts of Red Cross plasma in positive mode (a) and negative mode (b), and lipid extracts of substantia nigra in positive mode (c) and negative mode (d). c) Substantia nigra positive d) Substantia nigra negative Legend:
Figure S-5: Number of precursors selected for fragmentation across sequential injections after applying IE to negative and positive mode analysis of Red Cross plasma lipid extracts.
Log Transformed Peak Heights Figure S-6: Boxplots of log transformed peak heights from MZmine for lipids identified in the first ddMS2-top5 acquisition using LipidMatch (IE1) and after applying an exclusion list using the algorithm described in this paper (IE2, IE3, IE4, IE5, and IE6). Comparisons are made for lipid extracts of Red Cross plasma in positive mode.Differences between IE1 and IE2, were highly significant with a p-value for a student t-test less than 0.0000005. Differences in the following injections did not have significantly lower intensities (p-value > 0.05).
Figure S-7: Graphs are shown representing MS/MS spectral quality over sequential injections with and without applying IE. The dependent variable is the percent of lipids identified by LipidSearch which were graded A (high confidence and characterization of structural detail) over all grades (A + B + C). B and C grades indicate that there were less fragments identified for those lipids. Iterative exclusion-based data-dependent top5 (IE-ddMS2-top5) described in this paper is compared with traditional ddMS2 top5 for lipid extracts of Red Cross plasma lipid extracts in positive mode (a) and negative mode (b), and lipid extracts of substantia nigra in positive mode (c) and negative mode (d). a) Plasma positive b) Plasma negative c) Substantia nigra positive d) Substantia nigra negative Traditional ddMS2-top5 IE-ddMS2-top5 Legend:
Figure S-8: Boxplots of log transformed peak heights from MZmine for diglycerides (DGs) identified in the first ddMS2-top5 acquisition using LipidMatch (IE1) and after applying an exclusion list using the algorithm described in this paper (IE2, IE3, IE4, IE5, and IE6). Comparisons are made for Red Cross plasma lipid extracts in positive mode. IE1 IE2 IE3 IE4 IE5 IE6 Log Transformed Peak Heights
Figure S-9: Distribution of lipids identified using LipidMatch by lipid class using iterative exclusion-based data-dependent top5 (IE-ddMS2-top5) acquisitions in negative ion mode. The lipid class distribution of all identifications across sequential injections using the traditional ddMS2-top5 approach is shown for Red Cross plasma (a) and substantia nigra tissue lipid extracts (b). In addition, the distribution of additional unique lipid molecular identifications after applying iterative exclusion (IE) across lipid classes are shown for Red Cross plasma (c) and substantia nigralipid extracts (d). a) Plasma negative, without IE b) Substantia nigra negative, without IE c) Plasma negative, unique IE d) Substantia nigra negative, unique IE
DGs Figure S-10: Multilinear regression for predicting retention times of diglycerides (DGs) based on DG total carbons and degrees of unsaturation in the fatty acid constituents. DGs fatty acid constituents were determined using tandem mass spectrometry and an in-house identification software LipidMatch. Models explain the majority of the variance (97%) as expected. Therefore, the majority of LipidMatch identifications are verified by orthogonal separation, retention time, at least at the level of total carbons and double bonds.
TGs RT Figure S-11: Multilinear regression for predicting retention times of triglycerides (TGs) based on TG total carbons and degrees of unsaturation in the fatty acid constituents. TGs fatty acid constituents were determined using tandem mass spectrometry and an in-house identification software LipidMatch. Models explain the majority of the variance (97%) as expected. Therefore, the majority of LipidMatch identifications are verified by orthogonal separation, retention time, at least at the level of total carbons and double bonds. DB C
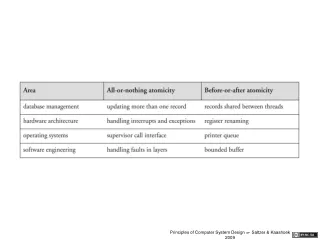
Table S-1: Gradient for reverse phase liquid chromatography of lipids. Mobile phase C consisted of 60:40 acetonitrile:water and mobile phase D consisted of 90:8:2 isopropanol:acetonitrile:water, with both containing 0.1% formic acid 10 mM ammonium formate. The flow rate was 500µL/min.
Table S-2: Mass spectrometric parameters. Abbreviations are: Res – resolution, AGC – automatic gain control, IT – injection time, NCE – normalized collision energy (stepped), ddMS2 – data-dependent tandem-mass spectrometry, Iso – isolation width, Apex – apex trigger, and DynExcl – dynamic exclusion. *For Red Cross plasma the stepped NCE was 20 ± 4
Table S-3: Source parameters (electrospray ionization (ESI))