Trace that Nitrate
Trace that Nitrate. An Overview of “Nitrate Stable Isotopes: Tools for Determining Nitrate Sources Among Different Land Uses in the Mississippi Basin” by Chang et. al. (2002). Jen Greenberg. Mississippi Atchafalaya River Basin (MARB) Facts:. 3 rd largest of the earth’s river basins

Trace that Nitrate
E N D
Presentation Transcript
Trace that Nitrate An Overview of “Nitrate Stable Isotopes: Tools for Determining Nitrate Sources Among Different Land Uses in the Mississippi Basin” by Chang et. al. (2002) Jen Greenberg
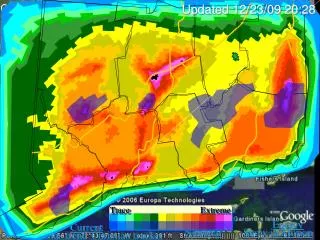
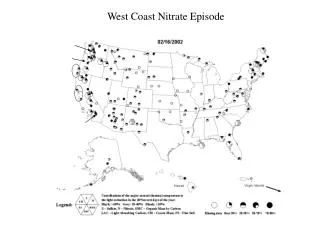
Mississippi Atchafalaya River Basin (MARB) Facts: • 3rd largest of the earth’s river basins • The Mississippi River drains into the Gulf of Mexico where it dumps 1.6 million metric tons of nitrogen, 61% of which is nitrate • Therefore it is a major contributor to the 17,000km2 hypoxic zone that exists in the Gulf of Mexico
Hypoxic Zones (World Resources Institute-PAGE, 2000) • Definition: An area of water containing less than 2mg/L of oxygen. • Also known as “dead zones” since little life can exist in these areas. • Main causes are the global increase in nitrate and phosphate pollution in the later part of the 20th century.
Study Basics: • The purpose of the study conducted by Chang et al. was to see if the specific sources of NO3 in the basin could be traced if levels of d15N and d18O were observed and analyzed • Having broken down their 24 test sites into “land-use categories” to help with their analysis, they discovered that “riverine nitrates from different land uses have overlapping but moderately distinct isotopic signatures”. • In addition, “at the basin scale, N flux is strongly correlated to discharge and season”.
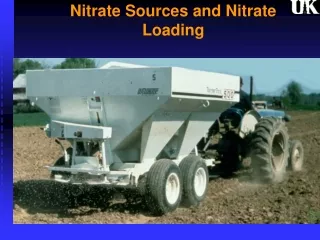
More Study Basics: • Sources of nitrates included in their study were manure, sewage/human waste, fertilizer and soils. Atmospheric deposition and denitrification were also taken into account. • The 24 sites were categorized as being small and either “crop”, “crop and livestock”, “urban” or “undeveloped”, or as being large and containing any combination of more than one of the above land-uses. • Though in reality land-uses overlapped at many of the sites, they obtained various observations and results from each site and land-use category.
Figure 1: Isotopic signature for different nitrate sources (from Kendall 1998)
Large River Sites: • No seasonal trends in NO3 concentrations and d15N or d18O values • No trends whatsoever when these sites were observed on an individual basis, but overall isotope ranges resemble those of crop sites • This is thought to be an outcome of high rates of dumping of nitrates into large rivers from crop sites
Crop and Crop and Livestock Sites • Again, on an individual basis, no trends were observed, but when viewed together an inverse relationship between d15N and NO3 was found • This inverse relationship is suggestive of manure when the actual values are low in winter, and of soils when the values are higher in spring and summer. • No trends at all were found between d18O and NO3 • At two sites, South Fork and Little Cobb, seasonal and discharge trends were observed. Discharge and NO3 were positively correlated and lowest in winter and highest in spring. d15N and d18O were inversely correlated to discharge. • Crop and Livestock sites had values of d15N approximately between 2 and 15 ‰, indicative of manure as the main source of nitrates at the bulk of these sites.
Undeveloped and Urban sites • At all of these sites, levels of NO3 and the number of samples collected were small, therefore no “discernable correlations” of any kind were found. • However a lower overall range (5.8-19.8‰) of d18O was found at undeveloped sites than at urban sites. This indicates that nitrates from soils are a larger contributor at undeveloped sites and that atmospheric nitrate is the larger contributor at urban sites.
Denitrification • Nitrates in d15N and d18O are heavier during denitrification • Although denitrification is observable using the isotopes, one can’t accurately determine if the process is actually taking place or where it might be taking place unless Lagrangian samples are utilized. • Dillution can create the illusion that denitrification is not occurring when it actually is.