Download
1 / 42
420 likes | 593 Vues
. „Solar variability – climate interaction“ AWI/IUP Blockseminar, Universität Bremen, 13. February 2006. The impact of the 11-year solar variability on climate Simulations with the Freie Universität Berlin Climate Middle Atmosphere Model (FUB-CMAM). . Ulrike Langematz. Objectives.

E N D
„Solar variability – climate interaction“ AWI/IUP Blockseminar, Universität Bremen, 13. February 2006 The impact of the 11-year solar variability on climate Simulations with the Freie Universität Berlin Climate Middle Atmosphere Model (FUB-CMAM) Ulrike Langematz
Objectives • Solar variability is caused by different processes (orbital parameters, magnetic processes in the Sun‘s interior). • It varies on different time scales: • millenium time scale (e.g. Holocene) • centennial time scale (e.g Maunder Minimum) • decadal time scale (e.g. 11-year Schwabe cycle) • 27-day rotation period • What is the contribution of solar variability to climate variability? • What is the contribution of solar variability to climate change?
Natural and anthropogenic climate factors IPCC, 2001
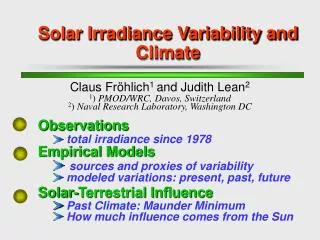
1369 1368 1367 1366 1365 1364 1363 78 80 85 90 95 00 03 Total Solar Irradiance (TSI) Total Solar Irradiance W/m2 0.1 % Fröhlich (2000), update: http://www.pmodwrc.ch/solar_const/solar_const.html Schwabe-Cycle
Solar signal in 30 hPa geopotential height Labitzke und van Loon (1995), updated
+2.5 K +0.8 K +0.8 K -1 K 0.5 K 1.75 K 0.5 K +1 K -0.25 K +0.25 K NCEP/CPC (1980-1997) SSU/MSU4 (1979-1997) Scaife et al. (2000) Hood (2004) Temperature signal: Observations ERA40 (1979-2001) SSU/MSU4 (1979-2003) Crooks and Gray (2005) Courtesy of Bill Randel (2005)
>50% in 121,6 nm (Lyman-α) 5-12% in 175-240 nm 3-5% in 240-260 nm Mechanisms I: Variations in UV-Radiation 11 year solar max minus min 0.1 % variation in TSI Lean et al., 1997
Low energy electrons Stay in thermosphere Max at solar maximum High energy electrons Stratosphere/mesosphere Max at solar minimum Solar proton events (SPEs) Thermosphere/mesosphere Max at solar maximum Galactic cosmic rays (GCR) Lower stratosphere Max at solar minimum Mechanisms II: Charged Particle Precipitation
Ozone Temperature Δ CP Δ UV Δ NOx / HOx chemistry Δ Absorption of solar UV-radiation Dynamics
Transfer of the solar signal from the upper to the lower atmosphere by • radiative coupling • dynamical coupling • chemical coupling
AG „Mittlere Atmosphäre“, Institut für Meteorologie, Freie Universität Berlin The Freie Universität Berlin Climate Middle Atmosphere Model (FUB-CMAM) Basis: ECMWF / ECHAM (Röckner et al., 1992) Resolution:T21 (5.6°x 5.6°), T42 (2.8°x2.8°) L19 (top at 10 hPa, ~30 km); L34, L70 (top at 0.0068 hPa, ~84 km) Physics: • Radiation-scheme for O3, CO2 and H2O (Morcrette, 1991) Absorption of UV/VIS by O3 in 8 bands >70 hPa (Shine&Rickaby, 1989) Absorption of UV/VIS by O2(Strobel, 1978) Newtonian-cooling for IR above 60 km • Hydrological cycle and vertical diffusion • Rayleigh-friction in upper mesosphere Ozone: Variable climatologies (e.g. Fortuin & Langematz, 1994) Ocean:Climatological or annually varying SSTs (AMIP) Pawson et al., 1998; Langematz (2000)
SW-radiation module • 43 bands in strato-and mesosphere • Absorption due to O3 and O2 • Lyman-alpha sun T21, L34 high resolution UV radiation QBO-module linear relaxation of zonal wind in the tropical lower stratosphere sun-qbo T21, L34 sun plus QBO-relaxation Chemistry module based on Steil et al. (2003) SLT-transport module based on Bräsicke, 1998; Mieth (2000) sun-chem T21, L34 sun plus chemistry & transport FUB-CMAM editions for solar cycle studies
Radiative coupling Sensitivity studies: Impact of UV-radiation Model: FUBCMAM sun (Pawson and Langematz, 1998; Langematz, 2000, Matthes et al., 2003) 11 –year cycle: • prescribed UV-changes (Lean et al., 1995) • prescribed ozone changes (J. Haigh) • perpetual january or ΔO3 ΔUV or
Radiative coupling Radiative Impact of UV and ozone changes FUB CMAM, max-min, perpetual January Short wave heating rates (K/day) solar UV IC-O3 Langematz and Matthes, 2005, in Vorbereitung Radiation and ozone changes are both important. . Direct radiative solar signal in temperature in the upper stratosphere.
Temperature signal due to UV and ozone FUB CMAM, max-min, annual mean Matthes et al., 2003 Significantly higher temperatures at solar maximum in the stratosphere Strongest temperature signal at the equatorial stratopause (> 1K)
Dynamical coupling Theoretical concepts Early Winter Anomalies 1. Initial radiative solar signal in upper stratosphere 2. Positive feedback between waves and zonal wind with poleward-downward“ movement of wind anomalies (Kodera, 1995) 3. Modulation of Mean Meridional Circulation (MMC) 4. Temperature changes in equatorial lower stratosphere Kodera and Kuroda (2002)
Dynamical coupling Observations: Solar cycle QBO 30 hPa height (m), Feb 1958-2003, NCEP/NCAR Phase of tropical stratospheric winds is important. max-min Major stratospheric warmings in solar maximum/QBO west (Labitzke and van Loon, 1988) Labitzke (2003)
Dynamical coupling QBO East QBO West Solar sensitivity studies: QBO Model: FUBCMAM sunqbo plus QBO relaxation: (Pawson and Langematz, 1998; Langematz, 2000, Matthes et al., 2004) 11 – year cycle: Prescribed UV- and ozone changes Matthes et al. (2004)
Dynamical coupling Nov J Dec J Jan J Feb J NH – winter circulation J (max – min) NMC Data (1979-1998) Model Major stratospheric warmings in solar solar maximum/QBO west (Labitzke and van Loon, 1988) Zonal wind Poleward-downward movement of zonal wind anomalies only with QBO-feedback 0.4 hPa 850 hPa Matthes et al. (2004)
Dynamical coupling stratospheric response tropospheric response Solar signal in the troposphere I high latitudes NH zonal wind anomalies (max-min) in winter 80 km 0 km Matthes et al. (2004) Downward propagation of wind anomalies from stratosphere to the troposphere throughout the winter
Dynamical coupling Nov Dec Jan Feb no significant surface signal significant surface signal (pos. AO) surface signal disappears Solar signal in the troposphere II high latitudes monthly mean geop. height differences (max-min) – 900hPa Matthes et al. (2004, 2006) Significant solar signal in lower troposphere in December and January
Dynamical coupling precipitation max-min (mm/d) w max-min (mm/s) w max-min January Solar signal in the troposphere low latitudes monthly mean differences in vertical motion and precipitation (max-min) Matthes et al. (2004, 2006) Significant changes in vertical motion, precipitation/cloud cover Lagged to changes in upper stratosphere by about 2 months
Chemical coupling Solar sensitivity studies: Ozone Calculated 2d-ozone change vs. observed ozone change? 2d CTMs, annual mean (%), max-min IC (Haigh, 1994) GISS (Shindell et al., 1999) 2d- chemical models do not reproduce the observed minimum in the equatorial middle stratosphere
Shindell et al. (1999) % 6 % SBUV/SBUVII (1980-1997) Hood (2004) Ozone signal: Observations SBUV/SBUV II (1979-1989) SAGEI/II (1984-1998) Lee and Smith (2003) Lee and Smith (2003)
Chemical coupling Solar sensitivity studies: ozone II Model: FUBCMAM chemsun(Langematz et al., 2005) (Pawson and Langematz, 1998; Langematz, 2000, Matthes et al., 2003) plus interactive chemistry 11 – year cycle: Prescribed UV changes Calculated ozone changes NOx-sources for REP precipitation Changes in chemistry module: • Changes of TOA fluxes in photolysis scheme(Landgraf and Crutzen, 1998) • Changes of Lyman- flux by 53.88% between solar min and max. • NOx sources > 55° lat on top 3 levels (>72 km) were reduced in sol max and enhanced in sol min (Callis et al., 1999, 2001).
Chemical coupling H2O [ppmv] – + Lyman- photolysis OH [molec/cm3] + + OH production Mesospheric ozone decrease (max-min) January Ozone [%] Mesospheric ozone decrease is due to stronger catalytic destruction by HOx. (Langematz et al., 2005)
Chemical coupling NO [ppbv] – Ozone [%] – thermospheric NOx source due to weaker EEP NO2 [ppbv] – High latitude ozone increase (max-min) January Stratospheric ozone increase due to weaker catalytic destruction by NOx. Polar ozone measurements confirm ozone changes due to REP (Sinnhuber et al., 2005). (Langematz et al., 2005)
Chemical coupling Ozone [%] Ozone increase in tropical lower stratosphere (max-min) annual mean • 50 hPa, Equator: • Ozone (max-min): = -5.8 % • Reaction dO3/dt (Min) dO3/dt (Max) • O3 + HO2 –297.74 –375.09 • NO2 + O3P –137.35 – 74.25 • OH + HO2 – 20.52 – 26.96 • ClO + O3P – 27.76 – 36.31 • Chemical sinks: –29.23 ppt/day But also radiative self-healing-effect ? Or effect of dynamical change ? (Langematz et al., 2005) Ozone decrease in lower tropical stratosphere partially due to chemical effect.
Conclusions • Direct radiatively induced solar signal in the upper atmosphere is well understood. • Recent progress in understanding downward transfer of solar signal into lower stratosphere and troposphere by indirect dynamical mechanism. • First progress in understanding chemical impact of solar variability. • Open questions remain concerning solar signal in stratospheric ozone, the troposphere and the ocean.
Current FUB activities • DFG-CAWSES-project ProSECCO (Project on Solar Effects on Chemistry and Climate Including Ocean Interactions) • 11-year solar signal in stratospheric ozone • 11-year solar signal in the troposphere and the ocean • using MA-ECHAM5-MESSy (cooperation with MPI-Chemie, Mainz) • centennial solar signal (Maunder Minimum and holocene) using FUB-EGMAM • cooperation with University Bremen (J. Notholt, M. Weber, M. Sinnhuber) • EC-project SOLVO (The Influence of Solar Variability on Climate) • 11-year solar signal ↔ QBO • 11-year solar signal in the troposphere • NCAR WACCAM (in cooperation with NCAR (USA)
FUB CMAM-CHEM solar cycle experiments • radiation: • Decrease of TSI = 1367.0 Wm-2 by 0.1% for solar min. • Spectral UV flux variations in 43 bands based on Lean et al., 1997 • chemistry: •TOA fluxes in photolysis scheme (Landgraf and Crutzen, 1998) were changed by (min to max) Interval (nm) %change 178.6 – 202.0 9.52 202.0 - 241.0 4.00 241.0 - 289.9 1.38 289.9 - 305.5 0.42 305.5 - 313.5 0.40 313.5 - 337.5 0.20 337.5 - 422.5 0.20 422.5 - 752.5 0.00 • Lyman- flux was changed by 53.88% from solar min to max. • NOx sources >55° lat on upper 3 levels (>72 km) are decreased at sol. max and increased at sol. min (Callis et al., 1999, 2001)
Solar impact studies: GCMs with coupled chemistry Ozone (%) and Temperature (K) solar (max-min) in FUB-CMAM-chem annual mean Ozone [%] Temperature [K] -3 3 -1 0 1 0 Langematz and Grenfell (2004)
Chemical coupling SBUV/SBUV2 satellite data 1980-1997 Hood, 2004 3 Ozone response (%) (max-min) annual mean Ozone [%] -3 0
Solar impact studies: Sensitivity studies Solar sensitivity studies: Radiation ⇔ OzoneFUB-CMAM-sun, max-min, perpetual January solar UV IC-O3 Radiation and ozone changes Between solar min and max are equally important. Langematz and Matthes (2004), in preparation
GRIPS solar cycle studies: NH winter circulation zonal wind, max–min (m/s) Nov Dec Jan Feb
GRIPS solar cycle studies: SW heating rates annual mean, max–min (K/d)
Solar sensitivity studies: OzoneFUB CMAM, max-min, perpetual January GISS-O3 IC-O3 Langematz and Matthes (2003), in preparation
Solar studies withcoupled chemistry • Met. Office UnifiedModel • 2.5° x 3.75°, L64, with chemistry (Austin, 2002) • TSI and spectral solar variations in radiation scheme and chemistry • 18 year integration • MA-ECHAM4/CHEMModel • T30 L39, chemistry (Steil et al., 1998) (Manzini and Mc Farlane, 1998) • TSI and spectral solar variations in radiation scheme and chemistry • 20 year integration • FUB-CMAM-CHEMModel • T21 L34, chemistry (Steil et al., 1998) (Langematz, 2000; Mieth et al., 2003) • TSI and spectral solar variations in radiation scheme and chemistry • 14 year integration • SOCOLModel • T30 L39, MA-ECHAM4 + MEZON (Rozanov, pers. comm) • TSI and of spectral solar variations in radiation scheme and chemistry • 20 year integration
Basis: FUB-CMAM: T21 L34 Chemistry: (Steil et al. 1998): 18 tracers I.e. CH4, N2O, H2O2, HCl, (HNO3+NAT), NOx, ClOx,Ox, CO, CH3OOH, ICE, ClONO2, F11, F12, CH3Cl, CCl4, CH3CCl3, H2; 107 gas-phase reactions (DeMore et al.,1994); 7 photolytic reactions (Landgraf and Crutzen, 1998); 4 heterogeneous reactions on PSCs and sulphate; tropospheric emissions and thermospheric NOx source Tracer transport: Semi-Lagrangian Transport Scheme (Böttcher 1996, Braesicke 1998, modified by Mieth 2000) Gravity waves: orographic: McFarlane (1987); Non-orographic: Hines (1997), Manzini and McFarlane (1987) The Berlin Climate Middle Atmosphere ModelFUB-CMAM-CHEM Mieth et al. (2003), in preparation.
Solar impact studies: Solar CCM-Intercomparison Ozone (%) solar max-min CCM Intercomparison more ozone: faster jO2 effect ? less ozone: faster jH2O effect ?
Solar impact studies: Solar CCM-Intercomparison Temperature (K) solar max-min CCM Intercomparison