Notes on Cluster Analysis
Notes on Cluster Analysis. Overview. Explanation of Observation Clustering (versus Variable Clustering) Types of Clustering Preparing Data for Clustering Assessing Clustering Results Demonstrations Fishers Iris Data Credit Data. Cluster Analysis. A few concepts:

Notes on Cluster Analysis
E N D
Presentation Transcript
Overview • Explanation of Observation Clustering (versus Variable Clustering) • Types of Clustering • Preparing Data for Clustering • Assessing Clustering Results • Demonstrations • Fishers Iris Data • Credit Data
Cluster Analysis A few concepts: • Clustering is UNSUPERVISED. • Used for segmentation of observations (versus variable clustering which is used for variable and redundancy reduction). • You will ALWAYS find a mathematical solution…which may or may not be meaningful. • It may not be generalizable.
Cluster Analysis Generally, we are trying to partition data into groups that are as internally similar as possible and as dissimilar as possible to other groups.
Cluster Analysis Types of questions answered by cluster analysis: • Are there characteristics of patients that define the state of a disease? • What sorts of complaints are most common in a call center? • What kinds of cars are people buying? And can I predict this? • Can I use credit attributes to create profitability segments?
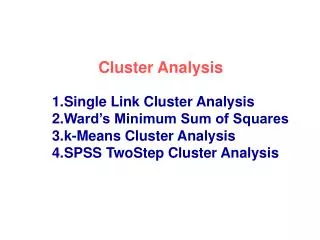
Cluster Analysis Types of Clustering: • Hierarchical • Agglomerative • Each obs starts in its own cluster • Merge the clusters that are the most similar • Repeat • Divisive • Each obs starts in a single cluster • Partition the observations that are the least similar into a second cluster • Repeat • Partitive (k-means)
Hierarchical Clustering Iteration Agglomerative Divisive 1 2 3 4
Old location X X X X X X X X X New location X X X “Seeds” Observations Initial State Final State Partitive Clustering
Cluster Analysis While there are pros and cons of each technique, Partitive (k-means) clustering is generally preferred with large datasets. However, Partitive clustering also: • Requires that you estimate the number of clusters present in the data (trial and error). • Is heavily influenced by selection of the seed – so outliers need to be “controlled”. • Is inappropriate for small datasets – because the solution becomes sensitive to the order in which the data is read.
Cluster Analysis All of the clustering techniques depend upon measurements of similarity or “distance” to assess assignment of an observation to a cluster. While there are many types of distance measurements, consider the common Euclidean Distance measurement…
Euclidean Distance Similarity Metric • Pythagorean Theorem: The square of the hypotenuse is equal to the sum of the squares of the other two sides. (x1, x2) x2 (0, 0) x1
Euclidean Distance Consider the impact on distance between RBAL and Age in their original units.
Cluster Analysis To control the impact of scale, standardization of the variables is recommended. The PROC STDIZE procedure provides for a wide range of standardization options including: Mean Median Sum Euclidean Length Standard Deviation (Z) Range MidRange (Range/2) MaxABS – Max Absolute Value IQR MAD AHUBER – Huber estimate AWAVE – Wave estimate L(p) – Minkowski distances
Cluster Analysis Again, each of these options has pros and cons. I encourage you to test multiple options – must like we did with the imputation options. For the current exercises, we will use the Range option and the Median option. Note that the Std (Z) option is highly sensitive to outliers.
Determining Optimal Number of Clusters We will use three basic metrics to determine the optimal number of clusters: • Cubic Clustering Criterion (CCC) • Pseudo-F Statistic (PSF) • Pseudo-T Statistic (PST)
FISHER’S IRIS DATA The data set consists of 50 samples from each of three species of Iris (Iris setosa, Iris virginica, and Iris versicolor). Four features of the flowers were measured from each sample: the length and the width of the sepals and the petals. Based on the combination of these four features, Fisher developed a discriminant model to distinguish the species from each other.
Clustering Fishers Data Step 1: Standardize the Data Step 2: Proc Cluster (hierarchical) Step 3: Analyze the ccc, pst and psf to determine the optimal clusters Step 4: Use the information from Step 3 and run ProcFastclus (k-means)
Credit Data Step 1: Standardize the Data (use ~ 10 variables) Step 2: Proc Cluster (hierarchical) Step 3: Analyze the ccc, pst and psf to determine the optimal clusters Step 4: Use the information from Step 3 and run ProcFastclus (k-means) Step 5: Determine the profitability by cluster