Download
1 / 11
110 likes | 245 Vues
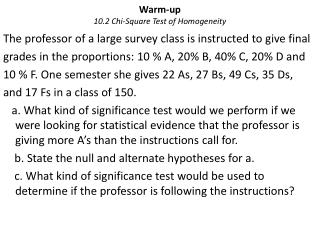
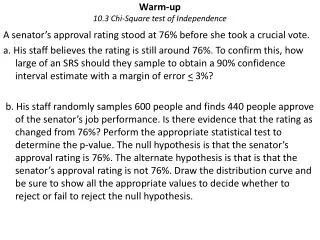
Warm-up 10.3 Chi-Square test of Independence. A senator’s approval rating stood at 76% before she took a crucial vote.

E N D
Warm-up10.3 Chi-Square test of Independence A senator’s approval rating stood at 76% before she took a crucial vote. a. He staff believes the rating is still around 76%. To confirm this, how large of an SRS should they sample to obtain a 90% confidence interval estimate with a margin of error < 3%? b. Her staff randomly samples 600 people and finds 440 people approve of the senator’s job performance. Is there evidence that the rating as changed from 76%? Perform the appropriate statistical test to determine the p-value. The null hypothesis is that the senator’s approval rating is 76%. The alternate hypothesis is that is that the senator’s approval rating is not 76%. Draw the distribution curve and be sure to show all the appropriate values to decide whether to reject or fail to reject the null hypothesis.
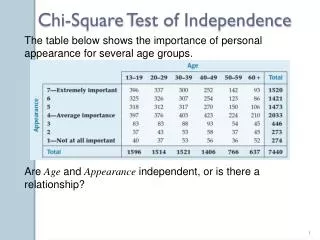
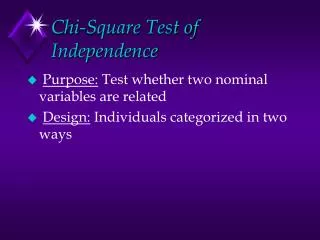
Χ2 Test of Independence is very similar the the Χ2 Test of Homogeneity, except you are looking at only two factors and the variations on those factors. Problem: A study from the University of Texas Southwest Medical Center examined whether the risk of Hepatitis C was related to whether people had tattoos and where they got their tattoos.
Tattoo and Hepatitis Problem Continued… The conditions are somewhat met. I’ll use a chi-square model with 2 df and a chi-square test of independence. I will proceed with caution because of the two cells that do meet the expected cell frequency. Step 2: Step 3:
Conclusion and χ2 Worksheet Problems Step 4: Type of χ2 Test for Worksheet Problems 1. 2. 3. 4.
First two problems of worksheet. • χ2 = 7.41 p-value 5.9% Conclusion: A p-value of 5.9% is low but it is would not considered statistically significant at the 0.05 level. There is not enough evidence that there a significant difference between the probability sampling of the election and the actual results. Therefore I fail to reject the null hypothesis. 2. χ2 = 61.26 p-value 3.15 x 10⁻¹³ Conclusion: A p-value of 3.15 x 10⁻¹³ , a χ2 model with 3 degrees of freedom it is far out on the tail of the graph and therefore it is extremely unlikely for the distribution of jurors’ age to be same as the population. H.W. Finish 3 and 4 of worksheet. Show all four steps for credit.
May 2nd (2 weeks from Wedneday)Cumulative Test • Start Reviewing – Unit Reviews posted on Sharepoint - The link to Dr. Tang’s Notes is posted on Sharepoint as well - Review old tests and quizzes • 12 multiple choice (3 from each of the Units- Data Analysis, Experimental Design, Probability and Inference) • 3 Free-Response (there will definitely be at least one inference free-response question) • You will have 70 minutes to complete the cumulative test. • You will only have the A.P. Exam formula sheet as reference during the exam. (You can print out the tables in the back of the book) • DO NOT rely on just the practice cumulative test to review. It should be just seen as practice.