Download
1 / 1
10 likes | 169 Vues
Modeling the Atmospheric Fate and Transport of Dioxin Emitted During in-situ Burning of Oil from the Deepwater Horizon Spill. Mark Cohen*, Roland Draxler, Richard Artz, Steven Fine, Hyun Cheol Kim, Daewon Byun + NOAA Air Resources Laboratory, College Park, MD .

E N D
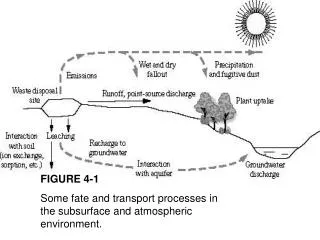
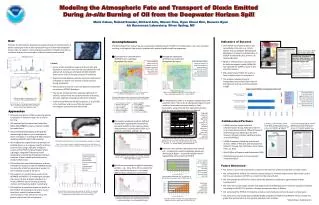
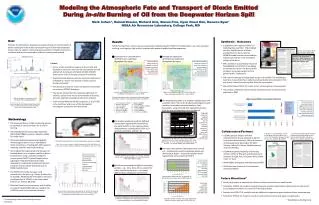
Modeling the Atmospheric Fate and Transport of Dioxin Emitted During in-situ Burning of Oil from the Deepwater Horizon Spill Mark Cohen*, Roland Draxler, Richard Artz, Steven Fine, Hyun CheolKim, DaewonByun+ NOAA Air Resources Laboratory, College Park, MD 1 – S.E. Plaquemines (0.019) 2 – Dauphin Island (0.016) 3 – Pensacola (0.012) 4 – Venice (0.0072) 5 – Stake Island (0.0069) 6 – Pascagoula (0.0011) 7 – Grand Isle (0.0010) 8 – Gulfport (0.00095) 9 – Biloxi (0.00066) 10 – Grand Bay NERR (0.00065) 11 – Mobile (0.00052) 12 – Slidell (0.00025) 13 – Houma (0.00018) 14 – New Orleans (0.00008) Goal Estimate the atmospheric deposition and ground-level air concentrations of dioxin resulting from the ocean-surface burning of oil from the Deepwater Horizon spill, to support a screening level assessment of health risks due to inhalation and due to consumption of dioxin contaminated seafood • Synthesis - Outcomes • In addition to the regional HYSPLIT-SV modeling discussed here, EPA modeled the near-field dispersion of dioxin emitted from the burns with the AERMOD model to assess the inhalation exposure of workers in the immediate vicinity of the burns • EPA used the air concentration results of the AERMOD and HYSPLIT-SV modeling to estimate the cancer risk due to dioxin inhalation to nearby workers and the general public, respectively Results PCDD/F emitted from oil-burning was successfully modeled using the HYSPLIT-SV model under a very time sensitive, evolving, multi-agency, high-priority situation with potential public-health consequences Environ. Sci. Technol.2010, Vol. 44, pages 9383–9389 Ground-level air concentrations of PCDD/F were estimated throughout the region Atmospheric deposition of PCDD/F was estimated throughout the region EPA used these model results to estimate on-shore inhalation exposure and the cancer risk associated with that exposure EPA used these model results as input to a food chain model to estimate dioxin concentrations in fish and risks to the general population from eating those fish • Context • As one of the methods to respond to the oil spill, 410 separate in-situ burns were carried out between April 28 and July 19, burning an estimated 222,000-313,000 barrels of oil (~5% of the total amount of leaked oil) • Polychlorinated dibenzo-p-dioxins and furans (referred to as PCDD/F or “dioxin”) are formed in trace amounts during combustion • The presence of chlorine in the combustion environment can enhance PCDD/F formation • The marine environment has relatively high levels of chlorine, and so there was concern that the oil burning activities might be releasing harmful levels of dioxin • There are 209 different PCDD/F congeners; 2,3,7,8-TCDD is the most toxic and is one of the most potent carcinogenic compounds ever discovered Volume of oil burned each day in barrels • EPA used the atmospheric deposition results of the HYSPLIT-SV modeling as input to a marine food chain model to estimate dioxin concentrations in fish and cancer risk to the general public from fish consumption • EPA utilized these HYSPLT-SV results in their screening level risk assessment • The analysis underwent several internal and external peer reviews and was published in ES&T Average modeled ground-level PCDD/F concentrations (fg TEQ/m3) from April 28 – July 22, 2010 Illustrative locations shown, numbered in descending order from highest to lowest average concentration (fg TEQ/m3): Total PCDD/F deposition flux (fg TEQ/m2) over the entire modeling period April 28 – July 22, 2010 Oil burn locations and volumes used for dioxin and air quality modeling The modeling was done on a congener-specific basis, and results for the 17 toxic 2,3,7,8-substituted congeners were combined to produce summary results as Toxic Equivalents, using standard toxic equivalency factors; both dry and wet deposition were considered The results of this screening analysis suggest that the risks from dioxin exposure from the oil burning activities were less than typical threshold values of concern Above two figures from: DaewonByun & Hyun CheolKim, Controlled Oil Burn Data for the Deep Water Horizon Gulf Oil Spill, NOAA ARL, 2010 Different congeners behave differently due to variations in physical- chemical properties, including those that affect vapor-particle partitioning • Methodology • EPA measured dioxin in DWH-oil-burning plumes to estimate an emissions factor for in-situ oil burning • ARL analyzed burn-by-burn data (relayed by NOAA NOS/OR&R) to create a dataset suitable for model input • ARL assembled/archived/extracted gridded meteorological data for use in atmospheric dioxin simulations, including both ARL’s regional modeling and EPA’s near-field modeling • ARL modeled the regional fate and transport of emitted dioxin, on a congener-specific and burn-by-burn basis, using a specially configured version of the HYSPLIT (Hybrid Single Particle Lagrangian Integrated Trajectory) model designed to simulate the atmospheric fate and transport of semi-volatile pollutants such as PCDD/F (HYSPLIT-SV) • The HYSPLIT–SV model has been used successfully in the past, e.g., Cohen, Draxler, Artz, et al (2002), Modeling the Atmospheric Transport and Deposition of PCDD/F to the Great Lakes, Environ. Sci. Technol.36, 4831 • Based on these previous successes and its ability to respond rapidly, NOAA ARL was asked by the USEPA to assist in this important analysis The analysis produced results for different assumptions regarding the treatment of non-detects (ND’s) in the emissions factor measurements, assuming ND=0, ND= 0.5 x Detection Limit (DL), and ND = DL • Collaborators/Partners • USEPA Exposure Analysis and Risk Characterization Group, National Center for Environmental Assessment, Office of Research and Development, Washington DC (John Schaum, Jeffrey B. Frithsen, Matthew Lorber, and Linda Phillips) • USEPA Atmospheric Modeling and Analysis Division, Office of Research and Development, Research Triangle Park, NC (Steven Perry, David Heist, S.T. Rao) • NOAA Office of Response and Restoration (ORR) • NOAA National Centers for Environmental Prediction (NCEP) P. Anastas, C. Sonich-Mullin, and B. Fried (2010). Designing Science in a Crisis: The Deepwater Horizon Oil Spill. Environ. Sci. Technol.44, 9250-51 J. Aurell and B. Gullett (2010). Aerostat Sampling of PCDD/PCDF Emissions from the Gulf Oil Spill In Situ Burns. Environ. Sci. Technol.44, 9431–9437 • Fraction of the total emissions of each congener deposited over the entire modeling domain (the entire domain was 10o x 10o, centered at the spill, twice as big as the 5o x 5o “results display” grid shown above) Schematic illustration of the in situ burn operations and plume sampling Figure 1 from Aurelland Gullett, Aerostat Sampling of PCDD/PCDF Emissions from the Gulf Oil Spill In Situ Burns, Environ. Sci. Technol.44, 9431–9437, 2010 Numerous mass balance calculations were carried out – including the results immediately above and the two plots below -- to provide insights into the regional fate and transport of PCDD/F Ground-level dioxin concentrations were very episodic, because burns occurred sporadically and the meteorological patterns were variable • Average modeled concentrations at 10 meter elevation for the entire modeling period at 14 selected locations in the Gulf of Mexico region Due to plume rise, the highest average deposition flux occurred approximately 50-75 km away from the DWH spill site Results were produced for different averaging periods -- e.g., 3 hrs, 8 hrs, 24 hrs, and for the entire duration of the burns – to support different types of exposure assessments Average dioxin deposition flux (fg TEQ/m2) at different distances away from the DWH spill site • Future Directions# • Sensitivity analyses to examine the influence of key uncertainties on model results • Extend the HYSPLIT-SV model to simulate Polycyclic Aromatic Hydrocarbons (PAH’s) and use this tool to assess exposure to PAH’s as a result of oil burning activities • Evaluate the HYSPLIT-SV model further by additional comparisons against ambient dioxin measurements • Extend the HYSPLIT-SV model to include a multi-media terrestrial and aquatic surface layers ~25% of the emitted PCDD/F was deposited within 250 km of the DWH site Hourly PCDD/F concentrations estimated by the HYSPLIT-SV model (at 10m) for June 8-24 at several locations in the Gulf of Mexico region resulting from dioxin emissions from in-situ oil burning Maximum modeled one-hour average concentrations at 10 meter elevation for the entire modeling period at 14 selected locations in the Gulf of Mexico region Cumulative fraction of dioxin emissions deposited at different distances away from the DWH spill site * Corresponding author: mark.cohen@noaa.gov #Depending on funding levels + Deceased