The Atmospheric Circulation System
The Atmospheric Circulation System. Geos 110 Lectures: Earth System Science Chapter 4: Kump et al 3 rd ed. Dr. Tark Hamilton, Camosun College. Overall the Earth’s Climate is in Balance. In Balance Kind-of : But you have to average over night and day

The Atmospheric Circulation System
E N D
Presentation Transcript
The Atmospheric Circulation System Geos 110 Lectures: Earth System Science Chapter 4: Kump et al 3rd ed. Dr. Tark Hamilton, Camosun College
Overall the Earth’s Climate is in Balance In Balance Kind-of: • But you have to average over night and day • It helps to average for many seasons or years • And we need to overlook trivialities like burning all of Earth’s fossil Carbon from the past ~350 Ma in < 3 centuries! However: • Region to region there are hot and cold spots, wet and dry places, rain forests and deserts, mountains and plains, seas and glaciers, tropics and polar climes & a whole lot of weather!
The Ideal Gas Law: Relationships of Pressure, Temperature, Volume & Moles Ideal Gas Law: • P V = n R T; P=Pressure, T=Temperature, n=moles of gas particles (with mass), R=ideal gas constant Special Case 1 – Boyle’s Law: (@ T=constant) • Pinitial Vinitial = Pfinal Vfinal • PV has units of work e.g. F/d2 x d3 = F x d • At constant E, a P increases V decreases Special Case 2 – Charles’ Law: (@ P=constant) • Vinitial / Tinitial = Vfinal / Tfinal 2
There are Big Latitudinal Differences Fig 4.1 • The Tropics have Energy Surplus • The Poles run a Deficit • Temperate zones have transitory seasonal swings
There are Big Latitudinal DifferencesIR emission doesn’t match? How does heat move? Fig 4.2 • The Tropics have a Net Radiation Surplus (Sin>Eout) • The Poles run a Net Radiation Deficit (Sin<Eout) • Temperate zones have transitory seasonal swings
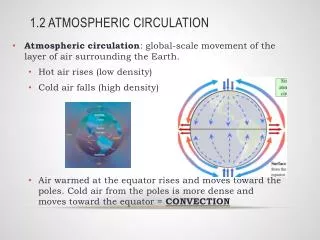
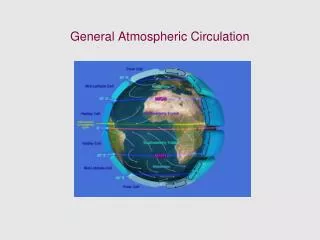
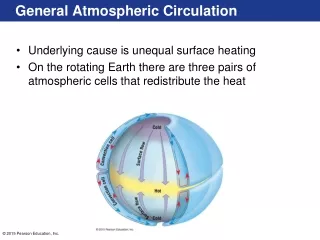
There has to be a Global Circulation System Fig 4.3 • IR conversion to Latent Heat (LiquidVapor) • Convection driven by density and pressure differences between different air masses Ferrel Cell Ferrel Cell
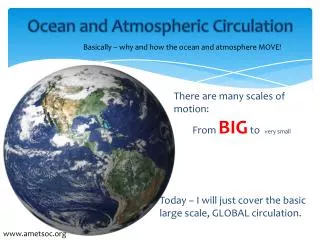
Convergent versus Divergent Windsat Earth’s Surface • Rising light warm air of the Tropic Lows is replaced laterally by denser air flowing in from higher latitudes & converges towards the ~Equator • This position changes seasonally by ~5° of Latitude • Descending cold dense air from the Horse Latitude Temperate Highs hits the Earths surface and gently diverges • This position is fixed by the stable Tropopause
Weather & Climate Vary Across the Globe Fig 4.4 • Wind & Ocean Currents Redistribute Solar Heating • Solid Earth processes buffer CO2 levels by weathering rocks over few hundred Ka to Ma • Eddies on all spatial & temporal scales prevent the heat redistribution from being complete or even.
Eastern Pacific & Central America w/ ITCZ Intertropical Convergence Zone Fig 4.5 • NOAA Satellite Image • Cloud Band marks ITCZ at top of Troposphere • The Troposphere, heated from below convects
Convective Towers Cumulonimbus drive Hadley Cells of ITCZ Fig 4.5 • Cloud Band marks ITCZ at top of Troposphere • Solar Evaporation & Latent Heat from Condensation make the heat pump that drives the Convection
Horizontal & Vertical Air Movements result from Temperature & Pressure differences driving Buoyancy • Buoyancy is due to density contrasts, Δmass/volume • Fast molecules, more collisions more F/A = Pressure • Temperature increase Pressure increase • Pressure increase Volume increase, buoyancy • Air columns heated from below expand and rise • Other denser air moves in laterally to replace it • Cooling upper Troposphere cools air shrinks & sinks
Mid-latitude Convective Mixing Fig 4.6 Cold fronts descend from higher latitudes Replacing/passing beneath tropical warm fronts This rapid mixing of air masses is an ever changing recipe for weather
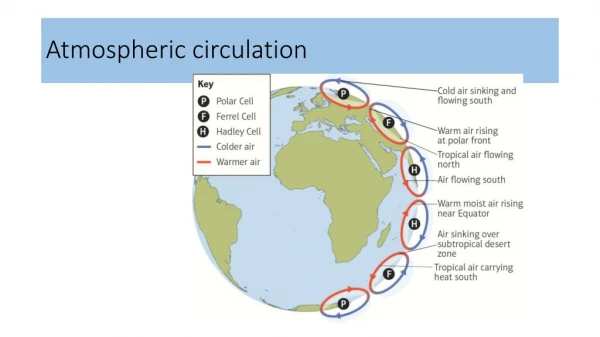
N-S Meridional Mixing of Troposphere Tropics to Horse Latitudes - Hadley Cells Mid-Latitudes – Ferrel Cells High Latitude - Polar Front Fig 4.7
Hadley Cells • Individual atmospheric cells • Between the Equator and 30-35° N • Over the ocean in Atlantic and Pacific • Driven by heat from below absorbed by ocean • The rocky planet rotates faster than the atmosphere • Hadley Cells are broken up by continents
The Horse Latitudes The Dead Horse Shanty Oh, poor old man your horse will dieAnd we say so, and we know soOh, poor old man your horse will dieOh, poor old man We'll hoist him up to the main yardarmWe'll hoist him up to the main yardarm Say, I old man your horse will dieSay, I old man your horse will die We'll drop him down to the depths of the seaWe'll drop him down to the bottom of the sea We'll sing him down with a long, long rollWhere the sharks'll have his body and the devil have have his soul • Spanish ships bound for the New World became becalmed w. Hi Pressure, no wind and Horses died • English “Dead Horse Shanty”, working off advance
Idealized Tropospheric Circulation ITCZ & Polar Front Storm Belts – Hi Precipitation Horse Latitude & Polar Deserts
A Simple Pressure Model for Winds Fig 4.8 • Winds blow out of descending High Pressure limbs ~30-35° N&S between Hadley & Ferrel Cells • Winds blow towards rising Low Pressure limbs on equatorial edge of Hadley Cells at ITCZ & also PCZ
Coriolis Rotational Effects on a Sphere 0 m/s Fig 4.9a • Since the Earth revolves once a day…. • Bantu’s and Guajiran’s move a lot faster and further • Than Innu or Lapplanders! 4.64 m/s
Apparent Wind Deflection to the Right N in N.Hem. (rotating reference frame) While the Earth revolves from AA’ & BB’ The N flowing Air moves from P1 X, This is really in a straight line viewed from Space Fig 4.9b The curved paths are relative to fixed points on the ground which revolves.
Coriolis (Centrifugal) Force acts on East or West moving Winds (increasing w/Latitude) Fig 4.10 • A Vector with 2 components in a plane defined by the spin axis and the location on the Earth’s surface • 1 Component is vertical, 1 horizontal-tangent away • In N Hem. E moving wind deflects Right to South
A More Realistic Model for Surface Winds:Pressure Differences, Buoyancy & Coriolis Effects Fig 4.11 Big Seasonal Changes • The same divergence & convergence zones are shown • Coriolis force effects are shown • Permanent Peri-equatorial Trades & Winter Polar Easteries Tropic of Cancer 23.5°N ~1 Season Tropic of Capricorn 23.5°S Big Seasonal Changes
High Pressure Systems tend to be Localized • Descending limbs of Hadley-Ferrel Cells in Mid latitudes tends to be fixed • Trade Winds blow from the Equator-ward side of these Sub-Tropical Highs • Temporary passing fronts of High or Low pressure form near the edge of the Polar Front affecting these • ~1000 km wide Low Pressure systems form from T° gradients and convective winds in upper troposphere • Inwards directed wind deflects to right in Northern hemisphere (Cyclonic Flow) • Outwards directed flow from Highs creates Anticyclones
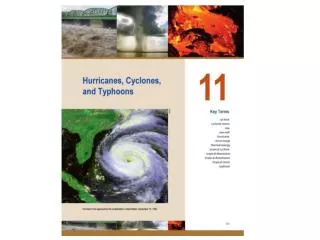
Tropical Cyclones: Hurricanes & Monsoons Box Fig 4.1 • The Circle is an Isobar = line of constant pressure • High Pressure winds deflect to the right • Hurricane flow is set by P gradient & Centripetal Acceleration* • Cyclonic storm rotate counterclockwise in North hemisphere • Cyclonic storms from at 26-27°C & > 5° Latitude from the Equator
Causes of Tropical Cyclones Box Fig 4.1 • Low Vertical Wind Shear or the storms tear apart as they build • Maximal humidity in lower Troposphere, builds latent heating • Steep vertical thermal gradient, promotes upwards buoyant convection • Initial atmospheric disturbance from ordinary Trade wind flow: old frontal boundaries, easterly waves (off Africa or S. Pacific), usually late summer & fall when ITCZ is furthest from equator
Extratropical Cyclones Box Fig 4.1 • From outside the tropics > 23.5° N or S latitude • Flow of Warm air from Equator hits cold air from High Latitudes • These air masses do not mix well so • Warmer less dense humid air rises above a cold front • Lots of Mid-latitude rain or snow • Lots of daily weather variations due to transient fronts
Flow of Troposphere Fig 4.7 Surface Flow is dominated by latitudinal belts Upper Level Flow is Dominantly Polewards!
Upper Level Tropospheric Flow The troposphere is warmer and thicker in the tropics & Colder and thinner at the Poles Fig 4.12a
Tropospheric Pressure Surfaces • Tropics more expanded & < vertical pressure gradient • Poles are more compressed w/ > vertical pressure gradients Fig 4.12b
Mid-latitude Upper Level Jet Streams At any elevation there is Hi P towards the Equator Flow naturally moves from High to Low Pressure These control the paths of Low Pressure Storms Flow Fig 4.12c
Geostrophic Wind Pressure Gradient decreases upwards (less mass) Coriolis Force decreases downwards, net Geostrophic Right/Left flow Centrifugal & Centripetal Forces contribute around Lows/Highs (Similar curved flow occurs across mid latitude continental shelves) Fig 4.13
Friction acts near surface at High Pressure Slows and deflects wind < 90° from coriolis Causes winds to spiral in cyclonic storms Fig 4.20 Fig 4.13
Height of the 300 mb Geopotential Surface in January (Winter N. Hem.) As per the previous 3 figures, this show the Polar Low & Equatorial High Fig 4.14
Seasonal Variation in Insolation Obliquity (tilt) affects vertical incidence & heating More than Eccentricity (elliptical orbit) At Spring-Fall equinoxes Sun is Overhead Fig 4.15 Perhelion Aphelion
The Analemma & Equation of Time • The maximum noon shadow And Elevation of the Sun trace out the Figure of 8 or Analemma over the year. • More heat at top and less at bottom
Seasonal Migration of Atmospheric Circulation Patterns The ITCZ shifts to the summer hemisphere side of the Equator and the weaker circulation cells shift Polewards Discreet Subtropical Highs mark descending Hadley Cells Fig 4.16