Download

1 / 12
120 likes | 216 Vues
Explore the error metrics and accuracy comparison of data vs. fitted curves in curve fitting. Learn about regression, surrogates, and fitting simulations. Understand linear regression, metrics, and different fitting techniques. Dive into examples and explore various fit metrics beyond the discussed ones.

E N D
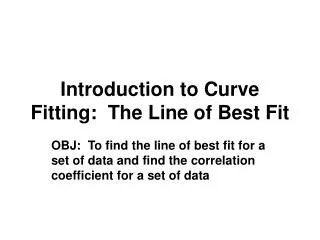
Curve fit metrics • When we fit a curve to data we ask: • What is the error metric for the best fit? • What is more accurate, the data or the fit? • This lecture deals with the following case: • The data is noisy. • The functional form of the true function is known. • The data is dense enough to allow us some noise filtering. • The objective is to answer the two questions.
Curve fit • We sample the function y=x (in red) at x=1,2,…,30, add noise with standard deviation 1 and fit a linear polynomial (blue). • How would you check the statement that fit is more accurate than the data? With dense data, functional form is clear. Fit serves to filter out noise
Regression • The process of fitting data with a curve by minimizing the mean square difference from the data is known as regression • Term originated from first paper to use regression dealt with a phenomenon called regression to the mean http://www.jcu.edu.au/cgc/RegMean.html • The polynomial regression on the previous slide is a simple regression, where we know or assume the functional shape and need to determine only the coefficients.
Surrogate (metamodel) • The algebraic function we fit to data is called surrogate, metamodel or approximation. • Polynomial surrogates were invented in the 1920s to characterize crop yields in terms of inputs such as water and fertilizer. • They were called then “response surface approximations.” • The term “surrogate” captures the purpose of the fit: using it instead of the data for prediction. • Most important when data is expensive and noisy, especially for optimization.
Surrogates for fitting simulations • Great interest now in fitting computer simulations • Computer simulations are also subject to noise (numerical) • Simulations are exactly repeatable, so noise is hidden. • Some surrogates (e.g. polynomial response surfaces) cater mostly to noisy data. • Some (e.g. Kriging) interpolate data.
Surrogates of given functional form • Noisy response • Linear approximation • Rational approximation • Data from nyexperiments • Error (fit) metrics
Linear Regression • Functional form • For linear approximation • Error or difference between data and surrogate • Rmserror • Minimize rms error eTe=(y-XbT)T(y-XbT) • Differentiate to obtain Beware of ill-conditioning!
Example • Data: y(0)=0, y(1)=1, y(2)=0 • Fit linear polynomial y=b0+b1x • Then • Obtain b0=1/3, b1=0, . • Surrogate preserves the average value of the data at data points.
Other metric fits • Assuming other fits will lead to the form , • For average error minimize Obtain b=0. • For maximal error minimize • obtain b=0.5
Original 30-point curve fit • With dense data difference due to metrics is small .
problems • Find other metrics for a fit beside the three discussed in this lecture. • Redo the 30-point example with the surrogate y=bx. Use the same data. 3. Redo the 30-point example using only every third point (x=3,6,…). You can consider the other 20 points as test points used to check the fit. Compare the difference between the fit and the data points to the difference between the fit and the test points. It is sufficient to do it for one fit metric. Source: Smithsonian Institution Number: 2004-57325