Download
1 / 36
370 likes | 1.02k Vues
Measurement of density and kinematic viscosity. S. Ghosh, M. Muste, F. Stern. Table of contents. Purpose Experimental design Experimental process Test Setup Data acquisition Data reduction Uncertainty analysis Data analysis. Purpose.

E N D
Measurement of density and kinematic viscosity S. Ghosh, M. Muste, F. Stern
Table of contents • Purpose • Experimental design • Experimental process • Test Setup • Data acquisition • Data reduction • Uncertainty analysis • Data analysis
Purpose • Provide hands-on experience with simple table top facility and measurement systems. • Demonstrate fluids mechanics and experimental fluid dynamics concepts. • Implementing rigorous uncertainty analysis. • Compare experimental results with benchmark data.
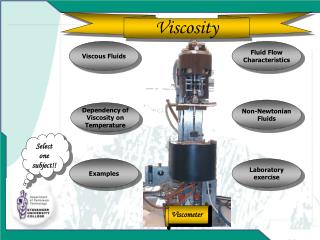
Experimental design • The facility includes: • A transparent cylinder containing • glycerin. • Teflon and steel spheres of different • diameters • Stopwatch • Micrometer • Thermometer • Viscosity is a thermodynamic property and varies with pressure and temperature. • Since the term m/r, where r is the density of the fluid, frequently appears in the equations of fluid mechanics, it is given a special name, Kinematic viscosity (n). • We will measure the kinematic viscosity through its effect on a falling object.
Test set-up • Verify the vertical position for the cylinder. • Open the cylinder lid. • Prepare 10 teflon and 10 steel spheres. • Clean the spheres. • Test the functionality of stopwatch, micrometer and thermometer.
Data Acquisition • Experimental procedure: • Measure room temperature. • Measure λ. • Measure sphere diameter using micrometer. • Release sphere at fluid surface and then release gate handle. • Release teflon and steel spheres one by one. • Measure time for each sphere to travel λ. • Repeat steps 3-6 for all spheres. At least 10 measurements are required for each sphere.
Data reduction • Terminal velocity attained by an object in free fall is strongly affected by the viscosity of the fluid through which it is falling. • When terminal velocity is attained, the body experiences no acceleration, so the forces acting on the body are in equilibrium. • Resistance of the fluid to the motion of a body is defined as drag force and is given by Stokes expression (see above) for a sphere (valid for Reynolds numbers, Re = VD/n <<1), where D is the sphere diameter, rfluid is the density of the fluid, rsphere is the density of the falling sphere, n is the viscosity of the fluid, Fd, Fb, and Fg, denote the drag, buoyancy, and weight forces, respectively, V is the velocity of the sphere through the fluid (in this case, the terminal velocity), and g is the acceleration due to gravity (White 1994).
Data reduction (contd.) • Once terminal velocity is achieved, a summation of the vertical forces must balance. Equating the forces gives: where t is the time for the sphere to fall a vertical distance l. • Using this equation for two different balls, namely, teflon and steel spheres, the following relationship for the density of the fluid is obtained, where subscripts s and t refer to the steel and teflon balls, respectively.
Data reduction (contd.) Sheet 2 Sheet 1
Experimental Uncertainty Assessment • Uncertainty analysis (UA): rigorous methodology for uncertainty assessment using statistical and engineering concepts. • ASME (1998) and AIAA (1999) standards are the most recent updates of UA methodologies, which are internationally recognized as summarized in IIHR 1999. • Error: difference between measured and true value. • Uncertainties (U): estimate of errors in measurements of individual variables Xi (Uxi) or results (Ur) obtained by combining Uxi. • Estimates of U made at 95% confidence level.
Definitions • Bias errorb: • Fixed and systematic • Precision errore: • ± and random • Total error:d = b + e
Propagation of errors Block diagram showing elemental error sources, individual measurement systems measurement of individual variables, data reduction equations, and experimental results
Uncertainty equations for single and multiple tests Measurements can be made in several ways: • Single test (for complex or expensive experiments): one set of measurements (X1, X2, …, Xj) for r • According to the present methodology, a test is considered a single test if the entire test is performed only once, even if the measurements of one or more variables are made from many samples (e.g., LDV velocity measurements) • Multiple tests (ideal situations): many sets of measurements (X1, X2, …, Xj) for r at a fixed test condition with the same measurement system
Uncertainty equations for single and multiple tests • The total uncertainty of the result • Br : same estimation procedure for single and multiple tests • Pr : determined differently for single and multiple tests
Uncertainty equations for single and multiple tests: bias limits • Br : • Sensitivity coefficients • Bi: estimate of calibration, data acquisition, data reduction, conceptual bias errors for Xi.. Within each category, there may be several elemental sources of bias. If for variable Xi there are J significant elemental bias errors [estimated as (Bi)1, (Bi)2, …(Bi)J], the bias limit for Xi is calculated as • Bike: estimate of correlated bias limits for Xi and Xk
Precision limits for single test • Precision limit of the result (end to end): t: coverage factor (t = 2 for N > 10) Sr: the standard deviation for the N readings of the result. Sr must be determined from N readings over an appropriate/sufficient time interval • Precision limit of the result (individual variables): the precision limits for Xi Often is the case that the time interval for collecting the data is inappropriate/insufficient and Pi’s or Pr’s must be estimated based on previous readings or best available information
Precision limits for multiple test • The average result: • Precision limit of the result (end to end): t: coverage factor (t = 2 for N > 10) : standard deviation for M readings of the result • The total uncertainty for the average result: • Alternatively can be determined by RSS of the precision limits of the individual variables
Uncertainty Analysis - density • Data reduction equation for density r : • Total uncertainty for the average density:
Bias limit Br Sensitivity coefficients Bias Limit for Density Correlated Bias : two variables are measured with the same instrument
Precision limit for density Precision limit
Uncertainty Analysis - Viscosity Data reduction equation for density n : Total uncertainty for the average viscosity (teflon sphere):
Bias limit Bnt(teflon sphere) • Sensitivity coefficients: Calculating Bias Limit for Viscosity No Correlated Bias errors contributing to viscosity
Precision limit P υ (teflon sphere) Precision limit for viscosity
Teflon spheres Typical Uncertainty results
Presentation of experimental results: General Format • EFD result: A ±UA • Benchmark data: B ±UB • E = B-A • UE2 = UA2+UB2 • Data calibrated at UE level if: • |E| UE • Unaccounted for bias and precision limits if: • |E| > UE
UA bands showing % uncertainty (Proctor & Gamble Co (1995)) Data analysis Compare results with manufacturer’s data
Flow Visualization using ePIV • ePIV-(educational) Particle Image Velocimetry • Detects motion of particles using a camera • Camera details: digital , 30 frames/second, 600×480 pixel resolution • Flash details: 15mW green continuous diode laser
Results of ePIV • Identical particles are tracked in consecutive images to have quantitative estimate of fluid flow • Particles have the follow specifications: • neutrally buoyant : density of SG ~ 1.0 • small enough to follow nearly all fluid motions: diameter~11μm • Qualitativeestimates of fluid flow can also be shown
Flow Visualization • Visualization-a means of viewing fluid flow as a way of examining the relative motion of the fluid • Generally fluid motion is highlighted by smoke, die, tuff, particles, shadowgraphs, Mach-Zehnder interferometer, and many other methods • Answer the following questions: • Where is the circular cylinder? • In what direction is the fluid traveling? • Where is separation occurring? • Can you spot the separation bubbles? • What are the dark regions in the left half of the image?
Flow Visualization-Flow around a circular cylinder • Flow around a sphere is approximated by a circular cylinder • Flow in laboratory exercise has a Reynolds number less than 1. • Flow with ePIV has a Reynolds number range from ~2 to 90. • Reynolds number = Re = (V∙D)/υ = (ρ ∙ V ∙ D)/μ Re= ~2 Re= <1 • Glycerine solution with aluminum • powder, V=1.5 mm/s, dia=10 mm • ePIV, water and 10μm polymer • particels, V=1.5 mm/s, dia=4 mm
Flow Visualization-Flow around a circular cylinder con’t • Flow separation occurs at Re ~ 5 • Standing eddies occur between 5 < Re < 9 • Length of separation bubble is found to grow linearly with Reynolds number until the flow becomes unstable about Re = 40 • Sinusoidal wake develops at about Re = 50 • Kármán vortex street develops around Re = 100 Re=1.54 Re=9.6
Flow Visualization-Flow around a circular cylinder con’t Re=26 Re=55 Re=30 Re=140
Flow Visualization-Flow around a circular cylinder con’t • Typical ePIV images Re=30 Re=60 Re=90