Download
1 / 1
10 likes | 149 Vues
1 m 2. 10 m 2. Med. 100 m 2. Large. Amanda R. Senft, Jason D. Fridley and Robert K. Peet. Abstract.

E N D
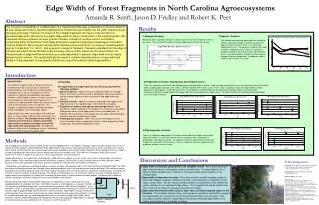
1 m2 10 m2 Med 100 m2 Large Amanda R. Senft, Jason D. Fridley and Robert K. Peet Abstract The long term sustainability of a habitat patch in a fragmented landscape is dependent on factors related to its size, shape and context. Important determinants of patch size and viability are the width, sharpness and influence of its edge. However, the choice of the variable measured can have a profound effect on perceived edge width. We set out to quantify edge width by using a multi-metric, multi-scalar approach. We measured change in species turnover, species richness, richness of invasive exotics, and floristic composition along 25 forest-farm field edges all located in piedmont agricultural landscapes of the North Carolina Piedmont. We surveyed vascular plant richness and percent cover in a series of nested quadrats varying in scale from 1 to 100 m2 and arrayed in a series of transects. Transects extended from the edge of the agricultural field, across the field-forest boundary, and up to 200 meters into the forest interior. All measurements of edge width were variable and scale dependent. In general, edge width is most clearly defined floristic turnover. Our results highlight the need for multiple characterizations of edge width and habitat in the assessment of how species distributions are influenced by habitat fragmentation. Results Edge Width of Forest Fragments in North Carolina Agroecosystems 1) Species richness: We did not find a significant change in species richness from forest edge to interior at any scale. Thus, we could not determine edge width based on species richness. 2) Species Turnover Our method of quantifying edge width was unable to detect a significant change in species turnover from edge to interior. However, there is an interesting explanation for this. The pattern of turnover from edge to interior is triphasic: that is, there is a significant change in species from 0 to 50 meters into the forest, there is a period of relative stability, and then another change in species composition. An opposite trend is shown at the smallest, 1m2 scale. Pattern of Species turnover based on Jaccard Similarity N.S. N.S. N.S. Introduction BACKGROUND The Piedmont region of North Carolina has been farmed intensively since European settlement, partitioning the once contiguous mixed evergreen-hardwood forests into small fragments. Forest fragments in agricultural landscapes have been relatively understudied. However, in order to conserve and manage the remaining forest fragments, it is essential to understand the effects that exterior forces exert on the boundary of these fragments. The changes in vegetation pattern resulting from these exterior conditions are termed edge effects. Edge effects have been assessed in many different ways, at many scales of observation and using many different variables. The purpose of this study is to examine several of these variables at multiple scales and to quantify the change in perceived edge width with each perspective. An additional purpose of this study is to propose a novel, statistically robust method of quantifying edge width. 3) Proportion of exotics, field species and nitrogen fixers: There is a significant, consistent edge width based on the proportion of exotics. Both the large and medium scales have distances around 15 meters while a slightly longer distance of 40 meters is determined from the smallest scale. There is also a significant, consistent edge width based on proportion of field species. A short distance of 24, 12 and 8 meters is determined from the data taken at large, medium and small scales, respectively. We were unable to determine edge width from the proportion of nitrogen fixers. All scales indicate an insignificant trend of nitrogen fixers from edge to interior. • HYPOTHESIS • We hypothesize that edge width will vary with scale and with the following variables: • Species richness: Species richness should be higher at the edge than in the interior, as there is both a blending of two communities as well as unique habitat for early successional and edge preferring species. • 2. Species turnover: Species turnover is predicted to be higher at the edge because of the rapid change in environmental variables. • 3. Proportion of exotics, field species and nitrogen fixers: There should be a higher abundance of nitrogen fixers and early successional field species closer to the edge, where there is available light. In addition, there should be more exotics near the edge, where propagule pressure and light availability are higher. • 4. Physiognomic turnover: When moving from the edge to interior, there should be a higher proportion of trees, a lower proportion of forbs and grasses and a lower proportion of vines. N.S. N.S. N.S. 4) Physiognomic turnover: There is a significant edge width of 20 meters determined at the large scale for both trees (an increase in trees from edge to interior) and graminoids (a decrease in graminoides from edge to interior). No signifcant trend was determined for either the medium or small scales for these traits. Also, no significant trend was determined for proportion of forbs, vines or shrubs. N.S. N.S. N.S. N.S. Methods We arranged plots along transects reaching into the mixed hardwood forests in the Northern Piedmont region of North Carolina. We set up 17 transects directly adjacent and perpendicular to the edge between these forests and agricultural fields and ran them up to 300 meters into the forest interior. At each transect, we surveyed vegetation using a modified version of the Carolina Vegetation Survey protocol (Peet et al 1998), a nested sampling design which tallies species identity and richness at multiple scales. Each plot was surveyed at three spatial scales: 100m2,10m2, and 1m2, known in the rest of this text as large,medium and small (Figure 1). Before data analysis, we used Kartesz and Meacham (1999) to classify species as trees, shrubs, forbs, herbs, or graminoids, and native or exotic. Nitrogen Fixers were identified using the USDA Plants Database (USDA 2004) as well as primary literature (Allen and Allen 1981). Species turnover was quantified as the log of Jaccard’s similarity for each plot from the first plot in its transect. Field Species were defined using Indicator Species Analysis (Dufrene and Legendre 1997) in PC-ORD (McCune and Mefford 1999). The 100m2 plots were classified by distance from the edge; those located completely within the field were given negative distances. We sorted the species according to the distance group for which they had the highest indicator value. To test for statistical significance, indicator values are compared to those of species randomly assigned to groups. This Monte Carlo procedure was run 1000 times to derive a p-value indicating whether a species occurs more frequently in a group than it would by chance given its relative frequency among all plots. All species with a negative distance (field plots) that had a significant p-value were labeled as field species. Discussion and Conclusions Acknowledgements Field Crew: Alenna Clements, Joel Gramling, Todd Jobe, Annika Dollander, Matt Kudla, Jenny Mayer, Eric Fridley, Christina Zakas, and Jessica Long. Financial Support: UNC Department of Biology, Syngenta Corporation Statistical Advice: Jack Weiss Literature Cited Allen, O.N. and E.K.Allen. 1981. The Leguminosae. The University of Wisconsin Press. Madison, WI. Dufrene, M. and P. Legendre. 1997. Species assemblages and indicator species: the need for a flexible asymmetrical approach. Ecological Monographs 67:345-366. Kartesz, J.T. and C.A. Meacham. 1999. Syntehsis of the North American Florida. Version 1.0. North Carolina Botanical Garden. Chapel Hill, NC. McCune, B. and M.J. Mefford. 1999. PC-ORD. Multivariate Analysis of Ecological Data Version 4.27. MjM Software Design, Gleneden Beach, Oregon. Peet, R.K., Wentworth, T.R. and P.S. White (1998). A Flexible, Multipurpose Method for Recording Vegetation Composition and Structure. Castanea 63(3): 262-274. USDA, NRCS. 2004. The PLANTS Database, Version 3.5 (http://plants.usda.gov). National Plant Data Center, Baton Rouge, LA 70874-4490 USA. • Edge width is relatively consistent for the variables tested. We found a significant edge effect for exotics, field species, graminoids and trees. The edge width for all of these variables ranged only 10 meters for the largest scale and 30 meters for the smallest scale. • Edge width is dependent on scale. There was as much variation between scales as there was between variables, indicating that scale is an important consideration in any study of edge width. We also found a random pattern of composition at the smaller two scales, resulting in non-significant edge effects. This suggests that scales smaller than 100 m2 are not as useful for studying compositional change. • Edge width determined in this study is lower than currently accepted values in the literature. The variables that we chose, most based on vegetation composition, suggest that edge effects do not penetrate much further than 20 meters into the forest. This contradicts previous studies of edge effects, which report average edge widths of 50 meters and maximums of hundreds of meters. Small We quantified edge width using breakpoint regression. A sharp bend in a loess regression line using aggregated data can yield poor estimates if individual transects are heterogeneous. A superior method is to use hierarchical breakpoint regression, an alternative to the commonly used "Helmert Procedure". In this technique, if there is an edge effect, the regression line between distance and the trait of interest will have a nonzero slope through the edge and will level off in the forest interior. Edge width is the point at which we switch between these two pieces of the regression. Each individual transect regression coefficient is treated as a random deviation from an underlying population value in a nonlinear mixed-effects model. Point estimates and 95% profile-likelihood based confidence intervals of the population edge width are reported. All statistical analyses were performed in S+, Version 6.1 and R, Version 1.9.1. Figure 1: Scales of Sampling