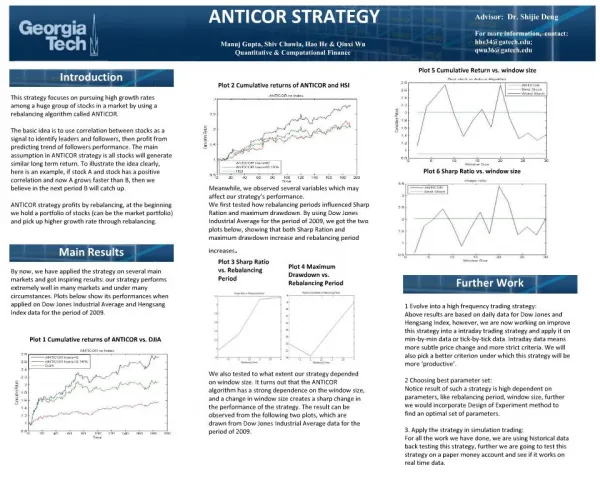
Download
1 / 19
190 likes | 373 Vues
School of Information Technologies The University of Sydney Australia. Spatio-Temporal Analysis of the relationship between South American Precipitation Extremes and the El Niño Southern Oscillation. Elizabeth Wu and Sanjay Chawla. Overview.

E N D
School of Information TechnologiesThe University of SydneyAustralia Spatio-Temporal Analysis of the relationship between South American Precipitation Extremes and the El Niño Southern Oscillation Elizabeth Wu and Sanjay Chawla
Overview School of Information TechnologiesThe University of SydneyAustralia • Aims • Motivation • Background • Experiments • Future Research • Questions SSTDM 2007
Aims School of Information TechnologiesThe University of SydneyAustralia • To discover the spatial and temporal relationships of high precipitation extremes between regions over South America • To compare the spatial and temporal behaviour of high precipitation extremes to the weather phenomenon known as the El Niño Southern Oscillation (ENSO), which is said to have a teleconnection with rainfall patterns SSTDM 2007
Motivation School of Information TechnologiesThe University of SydneyAustralia • Why look at high precipitation extremes? • High precipitation extremes can bring both devastation (destruction of property, disease, etc) and rejuvenation (replenish dry areas) • Why choose South America? • Data is available from the NOAA since 1940 • South Americans are particularly vulnerable to the effects of flooding • Why compare the behaviour of precipitation extremes to the Southern Oscillation Index (SOI)? • Further understanding of the teleconnection between precipitation extremes and the El Niño Southern Oscillation (ENSO) is required. SSTDM 2007
Motivation School of Information TechnologiesThe University of SydneyAustralia • Previous research has looked at the temporal nature of precipitation extremes and drawn qualitative spatial conclusions from their results • This research provides quantitative analysis of the spatial and temporal relationship of precipitation extremes SSTDM 2007
Background:South American Precipitation Data School of Information TechnologiesThe University of SydneyAustralia • Provided by the NOAA (National Oceanic and Atmospheric Administration) • NetCDF format • Daily data • 2.5° grids – data is averaged for each day from all stations in the grid • About 7900 stations SSTDM 2007
Background:South American Precipitation Data School of Information TechnologiesThe University of SydneyAustralia Considerations: • Extremes: • Fixed threshold – doesn’t consider seasonal variations • xth-percentile • Independent and Identical Distribution (iid) • Daily data is not independent, so deseasonalised weekly maximum data is used instead • Time Intervals • Selected data from ‘strong’ (as classified by the NOAA) El Nino events from 1978-2004 • Locations • Latitude 60°S to 15°N (31) • Longitude 85°W to 35°W (23) • Total number of regions: 713 • from all stations in the grid SSTDM 2007
Background:South American Precipitation Data School of Information TechnologiesThe University of SydneyAustralia Considerations: • Deseasonalisation • Consider a period eg. 1970-1989. • Take the weekly max of all weeks in that period • Subtract the period average of that particular week of the year (between 1-53) from each week. • Average is calculated as the sum of all non-missing values for that period divided by the total number of non-missing values. (f) Peak Over Threshold (POT) approach to selecting extreme values • Rather than using a pre-defined threshold, we use the top 95th percentile of weekly maxima residuals SSTDM 2007
Background:Extreme Value Theory School of Information TechnologiesThe University of SydneyAustralia • What are extreme precipitation values? • Significant deviations from the normal rainfall for a particular time of year - must be deseasonalised • In our study, they are the 95th percentile of precipitation values (top 5%) • How does EVT help to analyse them? What are the advantages over other techniques? • EVT only looks at the extreme values to understand past and future extremes, rather than looking at all of the data (ie. Looks at the tail of a distribution) • How is EVT applied to this study? • EVT is used to model precipitation extremes over different periods for each grid • From this, we obtain the parameters of the distributions • Use Moran’s I to determine the extent that the parameters from one region influence the parameter values of nearby regions SSTDM 2007
Background:Moran’s I Statistic School of Information TechnologiesThe University of SydneyAustralia • Moran’s I Statistic is a measure of spatial autocorrelation • Can be used to measure global and local correlation • Global models may not take into account spatial structural instability (large variations between regions), and so Local Indicators of Spatial Association (LISA) are best used for this purpose • Moran’s I may indicate • Positive autocorrelation: an event in one region increases the likelihood of the same event in a neighbouring region • Negative autocorrelation: an event in one region decreases the likelihood of the same event in a neighbouring region • No autocorrelation: an event in one region will have no effect on the likelihood of events in neighbouring region (random) SSTDM 2007
Background:El Nino Southern Oscillation School of Information TechnologiesThe University of SydneyAustralia • A naturally occurring phenomenon consisting of two phases: • El Niño (Warm) • La Nina (Cold) • El Niño is often associated with heavy precipitation in South America due to the warming of the East Pacific Ocean • Three measures of ENSO phases and strengths are: 1) Southern Oscillation Index (SOI) – atmospheric - measures the difference in Sea Level Pressure (SLP) between Tahiti and Darwin relative to the ‘normal’ SLP. 2) Sea Surface Temperatures (SST) - oceanic 3) Multivariate ENSO Index (MEI) – considers both atmospheric and oceanic measures SSTDM 2007
Experiments School of Information TechnologiesThe University of SydneyAustralia • The relationship between parameters of the extreme value distributions were evaluated using the Local Moran I statistic • Compared El Niño Southern Oscillation Index (SOI) for several strong El Niño periods with the average Local Moran I values over South America SSTDM 2007
Experiments School of Information TechnologiesThe University of SydneyAustralia • Strong El Nino periods obtained from the NOAA website: SSTDM 2007
Experiments School of Information TechnologiesThe University of SydneyAustralia • Of the 713 periods, only some contain data: SSTDM 2007
Experiments School of Information TechnologiesThe University of SydneyAustralia SSTDM 2007
Experiments School of Information TechnologiesThe University of SydneyAustralia • Bootstrap Analysis SSTDM 2007
Future Research School of Information TechnologiesThe University of SydneyAustralia • Compare the average Local Moran I to other ENSO indicators such as the SST and the MEI • Try other methods of spatial autocorrelation SSTDM 2007
Future Research School of Information TechnologiesThe University of SydneyAustralia • Compare the average Local Moran I to other ENSO indicators such as the SST and the MEI • Try other methods of spatial autocorrelation • Develop spatio-temporal data mining techniques to discover new and interesting patterns about extreme weather from data sets SSTDM 2007
Questions School of Information TechnologiesThe University of SydneyAustralia ? ? ? ? ? ? ? ? SSTDM 2007