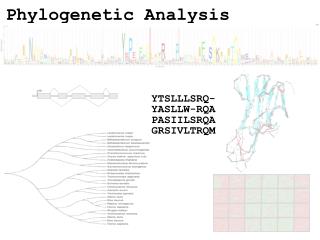
Topic : Phylogenetic Reconstruction
I. Systematics = Science of biological diversity. Systematics uses taxonomy to reflect phylogeny (evolutionary history). - Based on cladistic analysis ( will define shortly ) II . Taxonomy = identify, name and classify organisms. Carl Linneaus (Swedish Prof. 1707-1778)

Topic : Phylogenetic Reconstruction
E N D
Presentation Transcript
I. Systematics = Science of biological diversity. Systematics uses taxonomy to reflect phylogeny (evolutionary history). - Based on cladistic analysis (will define shortly) II. Taxonomy = identify, name and classify organisms. Carl Linneaus (Swedish Prof. 1707-1778) Binomial nomenclature, Genus species Topic : Phylogenetic Reconstruction
Kingdom Phylum Class Order - names end in “ales” Family - names end in “aceae” Genus species III. Hierarchial Taxonomic Grouping: Plants
Table. Classification of Large Ground Finch and Common Buttercup
After the publication of Charles Darwin’s book On the Origin of Species (1859) differences and similarities among organisms became to be seen as the result of their evolutionary history = phylogeny. Phylogenetic Trees = trace evolutionary relationships among taxa. taxa (plural) taxon (singular) = named taxonomic unit at any level. IV. Classification and Phylogeny
Monophyletic = members of taxa result from single common ancestor. Only legitimate taxa derived from cladograms! Polyphyletic = members of taxa result from more than one common ancestor. V. Types of Phylogenetic Trees
Homologous Traits = Common origin. Similarity in structure = reflects common ancestry Characters reflect ancestral past. Examples: VI. Homology vs. Analogy
Figure: Homologous structures: anatomical signs of evolution
Analogy = similarity in gross appearance and function DOES NOT reflect common ancestry. = traits or characters exhibit a common function BUT different evolutionary origins. Analogy DOES reflect similar selective pressures ----> Convergent Evolution. Ex., bird and insect wings, succulence in plants, Monotremes, marsupial, placental mammals VI. Homology vs. Analogy
Figure: Convergent evolution and analogous structures: cactus and euphorb
Three types of Mammals: Monotremes Marsupials Placental
Two Approaches: 1) Sequence of amino acids in proteins – of human genome only 2% 2) Sequence of nucleotides in nucleic acids DNA and RNA comparisons via sequencing, restriction mapping and hybridization. Much data now held in electronic data bases. Goal: Identify and compare homologous DNA sequences among taxa. VII. Molecular Markers aid Systematics
1. Select appropriate portion of genome to compare. Often mtDNA segments for recently diverged taxa. Often rRNA genes for distantly related taxa – evolves slowly. Example: Aligning segments of DNA Today utilize sophisticated computer programs to analyze differences between sequences. How to identifying homologous nucleotide sequences:
Goal is to provide an independent assessment for the origin of taxonomic groups in time. Based on the fact: some proteins, cytochrome C and some mitochondrial genomes evolve at a constant rate of evolution over time. Thus, Molecular clocks are calibrated in actual time = graphing differences in sequences against time. However, some proteins and nucleic acids evolve at different rates. Molecular clocks also assume constant Mutation Rate? Utility may be minimal Molecular Clock utility:
Figure: Dating the origin of HIV-1 M with a molecular clock: In 2000 estimated invasion of aids into humans in 1930s. Evidence also for multiple origins of AIDs invading humans as well.
Location of branch point = relative time of origin between taxa. Location of branch point = extent of divergence between branches or how different 2 taxa have become since diverging from a common ancestor. Recent branch versus deeper branch VIII. Science of Phylogentic Systematics B. Cladistics - uses novel homologies to define branch points.
Clade = evolutionary branch Cladistic analysis groups organisms by order in time, clades arose along a dichotomous tree. Each branching point indicates a novel homology unique to the species on the branch. Uses ONLY homologies to construct trees!!! DOES NOT use level of divergence. VIII. Science of Phylogentic Systematics C. Cladistic Analysis
Uses outgroup comparison = to recognize primitive traits members of the study group AND to establish a starting point for the tree. Outgroup = Species or a group of species relatively closely related to study group BUT clearly NOT as related as any study group members are to each other. Outgroup & study group may share primitivecharacters, likely shared a common ancestor. VIII. Science of Phylogentic SystematicsC. Cladistic Analysis
First, outgroup determines shared primitive character states. Next, examine synapomorphies = shared derived character states to construct the tree. Synapomorphies = novel homologous traits that evolved in an ancestor common to all species on ONE branch BUT not on other branch. Parsimony = simplest tree using the fewest changes to show evolutionary relationships. VIII. Science of Phylogentic Systematics C. Cladistic Analysis
Figure: Parsimony and the analogy-versus-homology pitfall: 4 chambered heart is analogous NOT homologous
Since focus solely on phylogenetic branching cladistic analysis accepts ONLY monophyletic study groups. Preferred approach is to use a combination of characters to design trees for study groups including: molecular, morphological, anatomical, ultrastructural, and developmental. VIII. Science of Phylogentic Systematics C. Cladistic Analysis Limitations