Download
1 / 41
410 likes | 570 Vues
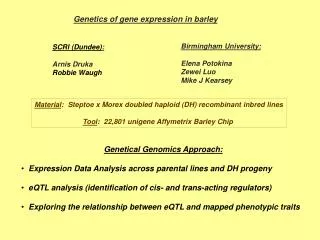
A Quantitative Overview to Gene Expression Profiling in Animal Genetics. Cluster Analysis …of genes with similar expression pattern. Armidale Animal Breeding Summer Course, UNE, Feb. 2006. A Quantitative Overview to Gene Expression Profiling in Animal Genetics. Clustering. Introduction.

E N D
A Quantitative Overview to Gene Expression Profiling in Animal Genetics Cluster Analysis …of genes with similar expression pattern Armidale Animal Breeding Summer Course, UNE, Feb. 2006
A Quantitative Overview to Gene Expression Profiling in Animal Genetics Clustering Introduction • Correlated genes are likely to be involved in the same biological pathway. • Genes transcribed (ie. Activated/Inhibited) by the same transcription factor(s) have a correlation higher than average. • The above two statements form the basis for the identification of new genes, gene functions and the reconstruction (ie. Reversed engineering) of gene regulatory networks. • Many clustering algorithms exists. • Here we shall review four: • Hierarchical Clustering • Agglomerative Linkage Methods • K-Means/Medians • Self-Organizing Maps (SOM) Armidale Animal Breeding Summer Course, UNE, Feb. 2006
A Quantitative Overview to Gene Expression Profiling in Animal Genetics Clustering The Guru http://www.hsph.harvard.edu/faculty/JohnQuackenbush.html Armidale Animal Breeding Summer Course, UNE, Feb. 2006
A Quantitative Overview to Gene Expression Profiling in Animal Genetics Clustering Introduction • Goal is identify genes (or experiments) which have“similar” patterns of expression • This is a problem in data mining • “Clustering Algorithms” are most widely used although many others exist • Types • Agglomerative clustering: Hierarchical • Divisive clustering: k-means, SOMs • Others: Principal Component Analysis (PCA) • All depend on how one measures DISTANCE • Although a set defined rules exists, clustering is an art. Armidale Animal Breeding Summer Course, UNE, Feb. 2006
A Quantitative Overview to Gene Expression Profiling in Animal Genetics Clustering Distance Metrics • Distances are measures of “between” expression vectors • Distance metrics define the way we measure distances • Many different ways to measure distance: • Euclidean distance • Pearson correlation coefficient (r) • r2 • Manhattan distance • Mutual information • Kendall’s Tau • etc. • Each has different properties and can reveal different features of the data Armidale Animal Breeding Summer Course, UNE, Feb. 2006
A Quantitative Overview to Gene Expression Profiling in Animal Genetics Clustering Correlation vs Euclidean Distance Correlation (X,Y) = 1 Eucl. Distance (X,Y) = 4 Correlation (X,Z) = -1 Eucl. Distance (X,Z) = 2.83 Correlation (X,W) = 1 Eucl. Distance (X,W) = 1.41 Armidale Animal Breeding Summer Course, UNE, Feb. 2006
A Quantitative Overview to Gene Expression Profiling in Animal Genetics Gene1 Gene2 Gene3 Gene4 Gene5 Gene6 Clustering Distance Matrix • Once a distance metric has been selected, the starting point for all clustering methods is a “distance matrix” Gene1 0 1.5 1.2 0.25 0.75 1.4 • Gene2 1.5 0 1.3 0.55 2.0 1.5 • Gene3 1.2 1.3 0 1.3 0.75 0.3 • Gene4 0.25 0.55 1.3 0 0.25 0.4 • Gene5 0.75 2.0 0.75 0.25 0 1.2 • Gene6 1.4 1.5 0.3 0.4 1.2 0 • The elements of this matrix are the pair-wise distances. Note that the matrix is symmetric about the diagonal. Armidale Animal Breeding Summer Course, UNE, Feb. 2006
A Quantitative Overview to Gene Expression Profiling in Animal Genetics G1 G6 G6 G5 G1 G2 G5 G2 G3 G4 G3 G4 Hierarchical Clustering 1. Calculate the distance between all genes. Find the smallest distance. If several pairs share the same similarity, use a predetermined rule to decide between alternatives. 2. Fuse the two selected clusters to produce a new cluster that now contains at least two objects. Calculate the distance between the new cluster and all other clusters. 3. Repeat steps 1 and 2 until only a single cluster remains. 4. Draw a tree representing the results. Armidale Animal Breeding Summer Course, UNE, Feb. 2006
A Quantitative Overview to Gene Expression Profiling in Animal Genetics g1 g1 g1 g8 g2 g8 g4 g2 g3 g4 g2 g3 g5 g4 g3 g6 g5 g5 g6 g6 g7 g7 g8 g7 g1 is most like g8 g4 is most like {g1, g8} Hierarchical Clustering Armidale Animal Breeding Summer Course, UNE, Feb. 2006
A Quantitative Overview to Gene Expression Profiling in Animal Genetics g1 g1 g1 g8 g8 g8 g4 g4 g4 g2 g5 g2 g3 g3 g7 g5 g2 g5 g7 g3 g6 g6 g7 g6 g5 is most like g7 {g5,g7} is most like {g1, g4, g8} Hierarchical Clustering Armidale Animal Breeding Summer Course, UNE, Feb. 2006
A Quantitative Overview to Gene Expression Profiling in Animal Genetics g1 g8 g4 g5 g7 g2 g3 g6 Hierarchical Clustering Armidale Animal Breeding Summer Course, UNE, Feb. 2006
A Quantitative Overview to Gene Expression Profiling in Animal Genetics Hierarchical Clustering Armidale Animal Breeding Summer Course, UNE, Feb. 2006
A Quantitative Overview to Gene Expression Profiling in Animal Genetics Hierarchical Clustering • Advantages • Computationally efficient • Produces tree-like structure • Disadvantage • Clusters are not optimal. Once branches split, it’s permanent. There is no way to reevaluate whether it was the best division based on whole data set. Armidale Animal Breeding Summer Course, UNE, Feb. 2006
A Quantitative Overview to Gene Expression Profiling in Animal Genetics Agglomerative Linkage Methods • Linkage methods are rules or metrics that return a value that can be used to determine which elements (clusters) should be linked. • Three linkage methods that are commonly used are: • Single Linkage • Average Linkage • Complete Linkage Armidale Animal Breeding Summer Course, UNE, Feb. 2006
A Quantitative Overview to Gene Expression Profiling in Animal Genetics Agglomerative Linkage Methods Single Linkage Cluster-to-cluster distance is defined as the minimum distance between members of one cluster and members of the another cluster. Single linkage tends to create ‘elongated’ clusters with individual genes chained onto clusters. DAB = min ( d(ui, vj) ) where u belongs to A and v belongs to B for all i = 1 to NA and j = 1 to NB DAB Armidale Animal Breeding Summer Course, UNE, Feb. 2006
A Quantitative Overview to Gene Expression Profiling in Animal Genetics Agglomerative Linkage Methods Average Linkage Cluster-to-cluster distance is defined as the average distance between all members of one cluster and all members of another cluster. Average linkage has a slight tendency to produce clusters of similar variance. DAB = 1/(NANB) ( d(ui, vj) ) where u belongs to A and v belongs to B for all i = 1 to NA and j = 1 to NB DAB Armidale Animal Breeding Summer Course, UNE, Feb. 2006
A Quantitative Overview to Gene Expression Profiling in Animal Genetics Agglomerative Linkage Methods Complete Linkage Cluster-to-cluster distance is defined as the maximum distance between members of one cluster and members of the another cluster. Complete linkage tends to create clusters of similar size and variability. DAB = max ( d(ui, vj) ) where u belongs to A and v belongs to B for all i = 1 to NA and j = 1 to NB DAB Armidale Animal Breeding Summer Course, UNE, Feb. 2006
A Quantitative Overview to Gene Expression Profiling in Animal Genetics Agglomerative Linkage Methods Comparison of Linkage Methods Average Single Complete Armidale Animal Breeding Summer Course, UNE, Feb. 2006
A Quantitative Overview to Gene Expression Profiling in Animal Genetics 1. Specify number of clusters, e.g., 5. 2. Randomly assign genes to clusters. G1 G2 G3 G4 G5 G6 G7 G8 G9 G10 G11 G12 G13 K-Means/Medians Clustering Process Armidale Animal Breeding Summer Course, UNE, Feb. 2006
A Quantitative Overview to Gene Expression Profiling in Animal Genetics G3 G6 G1 G8 G4 G5 G2 G10 G9 G12 G13 G11 G7 K-Means/Medians Clustering 3. Calculate mean/median expression profile of each cluster. 4. Shuffle genes among clusters such that each gene is now in the cluster whose mean expression profile (calculated in step 3) is the closest to that gene’s expression profile. 5. Repeat steps 3 and 4 until genes cannot be shuffled around any more, OR a user-specified number of iterations has been reached. K-Means is most useful when the user has an a priori hypothesis about the number of clusters the genes should group into. Armidale Animal Breeding Summer Course, UNE, Feb. 2006
A Quantitative Overview to Gene Expression Profiling in Animal Genetics K-Means/Medians Clustering Example Control Drug___ Expression 9 12 14 17 18 21 23 26 Average 13 22 9 12 14 17 18 21 23 26 1. Specify the existence of two clusters and assign them at random Armidale Animal Breeding Summer Course, UNE, Feb. 2006
A Quantitative Overview to Gene Expression Profiling in Animal Genetics K-Means/Medians Clustering Example Control Drug___ Expression 9 12 14 17 18 21 23 26 Average 13 22 9 12 14 17 18 21 23 26 21 9 14 26 16 19 17 23 12 18 2. Calculate Mean (Median) of each cluster and 3. Shuffle genes around so that each goes to the ‘closest’ cluster Armidale Animal Breeding Summer Course, UNE, Feb. 2006
A Quantitative Overview to Gene Expression Profiling in Animal Genetics K-Means/Medians Clustering Example Control Drug___ Expression 9 12 14 17 18 21 23 26 Average 13 22 9 12 14 17 18 21 23 26 21 9 14 26 16 19 17 23 12 18 4. Re-compute cluster Means (Medians) and 5. Re-shuffle genes til convergence is reached Armidale Animal Breeding Summer Course, UNE, Feb. 2006
A Quantitative Overview to Gene Expression Profiling in Animal Genetics K-Means/Medians Clustering Example Control Drug___ Expression 9 12 14 17 18 21 23 26 Average 13 22 9 12 14 17 18 21 23 26 21 9 14 26 16 19 17 23 12 18 21 9 14 26 13 22 17 12 23 18 Finish! Armidale Animal Breeding Summer Course, UNE, Feb. 2006
A Quantitative Overview to Gene Expression Profiling in Animal Genetics G7 G8 G1 G6 G5 G9 G2 N = Nodes G = Genes G4 G10 G3 G11 N1 N2 N3 N4 G12 G13 G14 G15 G26 G27 N5 N6 G28 G29 G16 G17 G19 G18 G23 G20 G21 G24 G22 G25 Self-Organizing Maps (SOM) 1. Specify the number of nodes (clusters) desired, and also specify a 2-D geometry for the nodes, e.g., rectangular or hexagonal Armidale Animal Breeding Summer Course, UNE, Feb. 2006
A Quantitative Overview to Gene Expression Profiling in Animal Genetics G7 G8 G1 G6 G5 G9 G2 G4 G10 G3 G11 N1 N2 N3 N4 G12 G13 G14 G15 G26 G27 N5 N6 G28 G29 G16 G17 G19 G18 G23 G20 G21 G24 G22 G25 Self-Organizing Maps (SOM) 2. Choose a random gene, e.g., G9 3. Move the nodes in the direction of G9. The node closest to G9 (N2) is moved the most, and the other nodes are moved by smaller varying amounts. The farther away the node is from N2, the less it is moved. Armidale Animal Breeding Summer Course, UNE, Feb. 2006
A Quantitative Overview to Gene Expression Profiling in Animal Genetics G7 G8 G1 G6 G5 G9 N2 G2 N1 G4 G10 G3 G11 G12 G13 N4 G14 G15 G26 G27 N3 G16 G28 G29 G17 G19 G18 G23 G20 N6 G21 N5 G24 G22 G25 Self-Organizing Maps (SOM) 4. Steps 2 and 3 (i.e., choosing a random gene and moving the nodes towards it) are repeated many (usually several thousand) times. However, with each iteration, the amount that the nodes are allowed to move is decreased. 5. Finally, each node will “nestle” among a cluster of genes, and a gene will be considered to be in the cluster if its distance to the node in that cluster is less than its distance to any other node. Armidale Animal Breeding Summer Course, UNE, Feb. 2006
A Quantitative Overview to Gene Expression Profiling in Animal Genetics Self-Organizing Maps (SOM) Perhaps a better view… Situate grid of nodes along a plane where datapoints are distributed Armidale Animal Breeding Summer Course, UNE, Feb. 2006
A Quantitative Overview to Gene Expression Profiling in Animal Genetics Self-Organizing Maps (SOM) Perhaps a better view… Sample a gene and subject the closest node and neighboring nodes to its ‘gravitational’ influence Armidale Animal Breeding Summer Course, UNE, Feb. 2006
A Quantitative Overview to Gene Expression Profiling in Animal Genetics Self-Organizing Maps (SOM) Perhaps a better view… Armidale Animal Breeding Summer Course, UNE, Feb. 2006
A Quantitative Overview to Gene Expression Profiling in Animal Genetics Self-Organizing Maps (SOM) Perhaps a better view… Sample another gene… Armidale Animal Breeding Summer Course, UNE, Feb. 2006
A Quantitative Overview to Gene Expression Profiling in Animal Genetics Self-Organizing Maps (SOM) Perhaps a better view… …and so on, and so on… Armidale Animal Breeding Summer Course, UNE, Feb. 2006
A Quantitative Overview to Gene Expression Profiling in Animal Genetics Self-Organizing Maps (SOM) Perhaps a better view… …until all genes have been sampled several times over. Each cluster is defined with reference to a node, specifically comprised by those genes for which it represents the closest node. Armidale Animal Breeding Summer Course, UNE, Feb. 2006
A Quantitative Overview to Gene Expression Profiling in Animal Genetics Self-Organizing Maps (SOM) • X-axis is time after dose • Y-axis is normalized gene expression level • Group ~1000 genes into 24 categories Results Armidale Animal Breeding Summer Course, UNE, Feb. 2006
A Quantitative Overview to Gene Expression Profiling in Animal Genetics Self-Organizing Maps (SOM) http://www.cis.hut.fi/research/som-research/worldmap.html Example Using 39 indicators of poverty and well-being from the World Bank, a map of the world where countries have been colored with the color describing their poverty type: Armidale Animal Breeding Summer Course, UNE, Feb. 2006
A Quantitative Overview to Gene Expression Profiling in Animal Genetics Self-Organizing Maps (SOM) http://www.cis.hut.fi/research/som-research/worldmap.html Example Armidale Animal Breeding Summer Course, UNE, Feb. 2006
A Quantitative Overview to Gene Expression Profiling in Animal Genetics Self-Organizing Maps (SOM) Details to Consider • Several methods exist for choosing initial data points for clusters. • How to choose the initial number of clusters. • Method of recalculating cluster center after adding a new data point can be varied. How much weight is given to new data point? • Routines for merging and dividing clusters and detecting outliers can be added at each iteration. • Advantages • Able to come closer to ‘optimal’ clustering through iterations. • Doesn’t force a tree-structure on data • Disadvantage • Larger number of options for clustering means that details of process may be hidden. Armidale Animal Breeding Summer Course, UNE, Feb. 2006
A Quantitative Overview to Gene Expression Profiling in Animal Genetics Comparing Clustering Methods Single Linkage Hierarchical Clustering K-Means with k = 4 SOM with 4 Nodes D’haeseleer (2005) Nat Biotech 23:1499 Armidale Animal Breeding Summer Course, UNE, Feb. 2006
A Quantitative Overview to Gene Expression Profiling in Animal Genetics PermutMatrix http://www.lirmm.fr/~caraux/PermutMatrix/ Caraux and Pinloche (2005) Bioinformatics 21:1281 Armidale Animal Breeding Summer Course, UNE, Feb. 2006
A Quantitative Overview to Gene Expression Profiling in Animal Genetics PermutMatrix Armidale Animal Breeding Summer Course, UNE, Feb. 2006
A Quantitative Overview to Gene Expression Profiling in Animal Genetics PermutMatrix Example Pregnancy vs Lactation vs Involution Armidale Animal Breeding Summer Course, UNE, Feb. 2006