Download
1 / 19
270 likes | 2.38k Vues
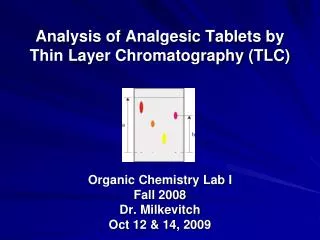
Analysis of Analgesic Tablets by Thin Layer Chromatography (TLC). Organic Chemistry Lab I Fall 2008 Dr. Milkevitch Oct 12 & 14, 2009. Separating Molecules. Today : Learn a separation technique Molecules can be separated by a number of methods: Extraction Precipitation Chromatography

E N D
Analysis of Analgesic Tablets by Thin Layer Chromatography (TLC) Organic Chemistry Lab I Fall 2008 Dr. Milkevitch Oct 12 & 14, 2009
Separating Molecules • Today: Learn a separation technique • Molecules can be separated by a number of methods: • Extraction • Precipitation • Chromatography • Chromatography = “to write in color” • Originally developed to separate components of inks
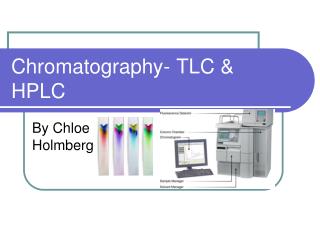
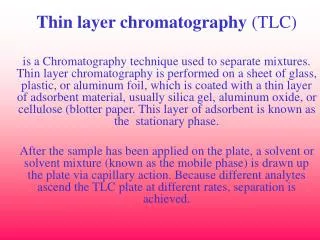
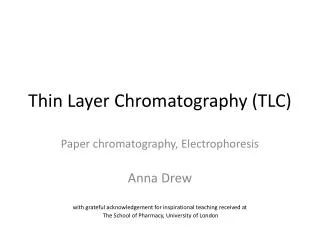
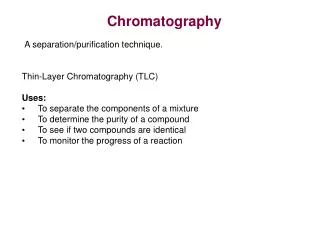
Thin Layer Chromatography • Thin Layer Chromatography: “The separation of moderately volatile or nonvolatile substances based upon differential adsorption on an inert solid (stationary phase) immersed in a organic solvent or solvent mixture (mobile phase)” • Makes use of: • A stationary phase: solid support • Mobile phase: a fluid • Basic principle of separation: • Differential interactions of molecules with these 2 phases
How the separation works • Molecules can move with the mobile phase • Or, they can remain fixed on the stationary phase • Called partitioning • How molecules partition between the 2 phases depends on: • Properties of the phases • Properties of the molecules being separated
How this works, continued • Molecules that partition into the mobile phase: • Will move more rapidly than molecules that partition into the stationary phase • Therefore, they will separate from those that are partitioned into the stationary phase Faster moving component partitioned more into mobile phase Solvent movement Slower moving component partitioned more into stationary phase Two component mixture applied to TLC plate
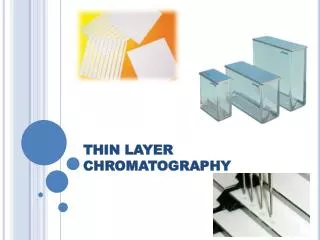
“Nuts and Bolts” of the Method • You must carefully select mobile and stationary phases to achieve full separation of mixtures of molecule • Trial and error • Stationary phase: thin layer of silica spread on a surface • Mobile phase: solvent system that migrates through the silica • Samples are spotted on the plate • Moved along by the solvent(s) migrating through the silica
Rf Values • Molecules that are separated will migrate as “spots” and their migration can be measured • Migration usually reported as an “Rf” value • Calculation of an Rf value: • Ratio of sample migration (how far spot moved) to solvent migration (how far the solvent moved) • Can be used to identify components in a mixture • Compared to standards • Today: look at the components of analgesic tablets by TLC • Look for the “actives”
Calculating an Rf Value Solvent Front Solvent Front = 5 cm Spot 1 moved 1 cm Rf = 1/5 = 0. 2 cm Spot 2 moved 4 cm Rf = 4/5 = 0. 8 cm Origin Spot 1 Spot 2
Analgesic Medications • “Analgesia”: Greek for the deadening or absence of pain without loss of consciousness • Analgesics: compounds that relieve pain • Range from aspirin to morphine, and other related narcotics • Many OTC (over the counter) analgesics available • Tylenol • Advil • Excedrin • Aspirin (various preparations)
Actives • OTC analgesics contain many compounds • The “active” is what relieves pain • Other compounds are binders, flavorings, colorants, stabilizers, solubility enhancers Paracetamol (acetaminophen) Ibuprofen Caffeine
Procedure • Obtain a silica gel plate from me • This plate will have a UV indicator in it • Draw a straight line (lightly, in pencil) approximately 2 cm from the bottom edge of your TLC plate. Use a ruler to do this. This is called the origin. • Draw a straight line (lightly, in pencil) about 1 cm from the top edge of your TLC plate. Again, use a ruler to do this. This is called the solvent front. • Mark 5 spots (in pencil) along the origin. Distribute the spots evenly along the origin. • Obtain the TLC standards. These are solutions of known components of the analgesic tablets. They include: • Caffeine • Acetylsalicylic Acid (aspirin) • Ibuprofen • Acetaminophen
Procedure, con’t • Spot the TLC plates with the TLC standards and 1 unknown. Use a spotting capillary or the small diameter plastic dropper. Make the spots small (approx 1 mm in diameter). • Before you do this, ask me or Scott/Nicole to demonstrate on your plate • Preheat the TLC plate in the 50 C oven for 5 min. This will dry the spots. Sometimes you will need to dry the plates for a longer period of time.
What your TLC Plate will Look Like Solvent front (drawn lightly in pencil) origin
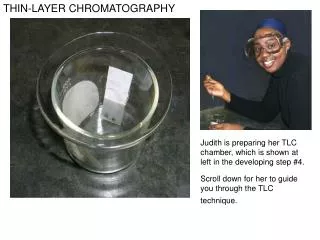
Procedure (con’t) • Make a TLC tank (called a developing tank). Use a 250 ml beaker. Add a few ml of the mobile phase to the beaker • Mobile phase: ethyl acetate • Place a piece of filter paper in the beaker • Will allow the beaker to fill with solvent vapor • Cover TLC tank with a watch glass/parafilm
TLC Tank Watch glass Filter paper Mobile phase
Developing • Place TLC plate (spotted) in the tank. Solvent level must be below the origin, otherwise you’ll lose your spots • Tilt plate over a bit onto the side of the beaker • Shouldn’t touch the filter paper • Watch the migration of the solvent • Remove the plate from the TLC tank when the solvent is exactly at the solvent front line • Let the plate dry • Visualize the plate using the UV box • See me to demonstrate use of the UV box • After this, further develop the plate in the iodine tank • Iodine will react with the spots • Makes the spots yellow • When fully developed, remove and circle the spots with pencil
Results • Measure the distance the solvent (mobile phase) traveled • Bottom to the solvent front line • Measure the distance from the center of each spot to the origin • Calculate Rf values for each spot Distance spot traveled Rf = Distance solvent traveled
Results II • Attempt to identify what the spots are in your unknown • Compare the Rf values of the standards versus the Rf values of the spots in your unknown • If they match closely, then you have that component in your unknown • Can you identify what unknown you have? • Possibilities: Advil, Tylenol, Excedrin • Be sure to draw a figure of your TLC plate • Identify all standards, and all spots • Show calculations of your Rf values
Conclusions: Things to Think About • What can we conclude? • Did your TLC plate work? • Were you able to spot your plate successfully, and develop the plate? • Did you see the spots for the standards? • For your unknown, did you see a spot or spots? • Were you able to resolve the different spots? • Did the spots separate from each other? • This is what we are trying to do!!!! • Could you identify your unknown? • See me for the identity of your unknown • If you did, then you have successfully utilized TLC to identify your unknown compound