Download
1 / 1
10 likes | 405 Vues
PCM (B06.22) Observed PCM - Observed Annual MAM JJA Evaluation of Hydrologically Relevant PCM Precipitation Characteristics over the Continental U.S. C. M. Zhu, A.W. Wood and D.P. Lettenmaier

E N D
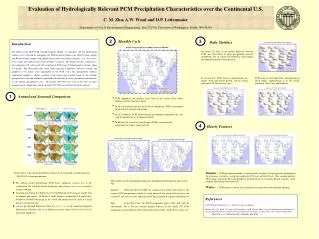
PCM (B06.22) Observed PCM - Observed Annual MAM JJA Evaluation of Hydrologically Relevant PCM Precipitation Characteristics over the Continental U.S. C. M. Zhu, A.W. Wood and D.P. Lettenmaier Department of Civil & Environmental Engineering, Box 352700, University of Washington, Seattle, WA 98195 2 3 Monthly Cycle Introduction The ability of the DOE PCM ( Parallel Climate Model ) to reproduce selected precipitation statistics was evaluated by comparing the PCM historical climate runs B06.22 (daily output) and B06.64 (hourly output) with gridded observations (described in Maurer, et al. (in review)) over a range of temporal scales from sub-daily to annual. The domain for this comparison is the continental U.S. with a grid cell resolution of PCM scale (T42 horizontal resolution, about 2.8 degree). The observation data, taken from long-term Cooperative Observer stations and gridded to 1/8 degree, were aggregated to the PCM scale. The precipitation statistics comparison includes i) spatial variation in the annual and seasonal mean; ii) the monthly precipitation cycles and cumulative probability distribution; iii) daily precipitation distribution; iv) the diurnal precipitation cycle. The period 1950-1999 was used as the basis for daily through annual comparisons; and the period 1995-1999 was used for the hourly analysis. Daily Statistics In eastern US, there is no obvious difference between PCM and observation in daily precipitation intensity distribution, but in central US, PCM has much higher precipitation intensities than observed. In western US, PCM tends to underestimate the longer storm inter-arrival periods, and in eastern and central US the reverse is true. PCM tends to overestimate the storm duration in Great Plains, underestimate it in the Pacific Northwest, West Coast and Northeast. 1 Annual and Seasonal Comparison • PCM reproduces the monthly cycle well in the eastern Great Plains, Midwest and the Ohio River basin. • In the Great Plains and east of the Rocky Mountains, PCM overestimates precipitation in summer and autumn. • In the Southeast, PCM underestimates precipitation throughout the year, with the greatest biases in summer and fall. • In Western US, east of the coastal ranges, PCM overestimate the precipitation in winter, spring and fall. 4 Hourly Features SON DJF Shown above is the spatial distribution comparison of annual and seasonal long-term (1950-1999) average precipitation. For annual average precipitation, PCM shows significant negative bias in the southeastern US and in the Pacific Northwest, and a large positive bias centered in eastern Colorado. In spring and autumn, the differences between PCM and observation are smaller than in summer and winter: PCM has a small negative southeastern US and Pacific Northwest for both. For spring, in the central and northeastern US, there is a small positive precipitation bias. summer precipitation differences drive the positive bias in the annual precipitation difference in Colorado, and winter differences are the source of the negative bias in the Pacific Northwest. Summer: PCM precipitation exhibits a strong diurnal variation, with precipitation maximum in the afternoon, everywhere except the southeastern US coast and Gulf Coast. This variation matches observations well in the West and Southeast, but particularly overestimates diurnal variation in the northern Great Plains and Central US. Winter: PCM matches well the lack of diurnal variation in observed winter precipitation. Shown above are the precipitation cumulative probability distributions for January and July. January: PCM and observed CDFs are similar in the eastern US; however, the extreme PCM precipitation is much less than observed. For much of the western and central US, the reverse is true, and generally PCM precipitation is greater than observed. July: In the East Coast, the PCM precipitation agrees fairly well with the observations, but is low for extreme months; whereas in the central US, PCM simulation is greater than the observed at nearly all percentiles. In the West, results vary. References For PCM model information, see: http://www.cgd.ucar.edu/pcm/ Maurer, E.P., A.W. Wood, J.C. Adam, D.P. Lettenmaier, and B. Nijssen, 2001, A Long-Term Hydrologically-Based Data Set of Land Surface Fluxes and States for the Continental United States, J. Climate (in review). Draft available from: http://www.ce.washington.edu/~edm/pub_pres.html