Download
1 / 16
160 likes | 184 Vues
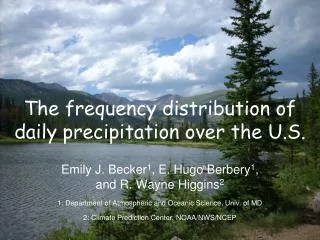
The frequency distribution of daily precipitation over the U.S. Emily J. Becker 1 , E. Hugo Berbery 1 , and R. Wayne Higgins 2 1: Department of Atmospheric and Oceanic Science, Univ. of MD 2: Climate Prediction Center, NOAA/NWS/NCEP. Outline.

E N D
The frequency distribution of daily precipitation over the U.S. Emily J. Becker1, E. Hugo Berbery1, and R. Wayne Higgins2 1: Department of Atmospheric and Oceanic Science, Univ. of MD 2: Climate Prediction Center, NOAA/NWS/NCEP
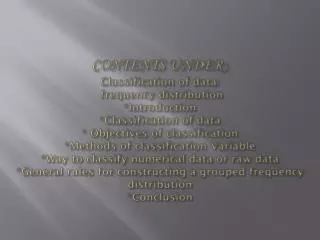
Outline Objective: Examine the seasonal characteristics of the frequency distribution of precipitation and its dependence on the lower frequency modulation of ENSO during winter • Introduction, Data and Method • Seasonal precipitation frequency distribution • Seasonal frequency distribution of precipitation-related variables • ENSO modulation of precipitation and precipitation-related variables • Summary & conclusions
Daily precipitation • Changes in the frequency and intensity of daily precipitation within a season can occur independently from changes in seasonal mean • More extreme events can lead to high streamflow, flooding (Groisman et al. 2001) • Often see greater increase in extremes than in mean total
Data: NARR • North American Regional Reanalysis • 1979-present (1979-2005 for this study) • 32-km horizontal resolution, 45 vertical layers • Developed with 2003 version of the Eta model; Eta model coupled with Noah land surface model • Precipitation is assimilated • Extremely high agreement between NARR precip. and observations
Gamma distribution • pp distrib. positively skewed, bounded on left by 0 • Shape (α) describes skewness • Scale (β) stretches or shrinks along x-axis α β = mean
winter (JFM) precipitation • scale-dominated areas (large scale, small shape): more precipitation received from extremes • shape-dominated areas (large shape, small scale): more precipitation from more-frequent lighter events * • in winter, most areas with high wet-day mean are scale-dominated • northern Plains and Great Lakes are shape-dominated • Atlantic and Gulf of Mexico coasts are scale-dominated wet-day mean frequency scale shape * After Husak et al. (2007)
summer (JAS) precipitation Great Plains Low-Level Jet: scale-dominated North American monsoon Southeast: mean dominated by light/moderate wet-day mean frequency scale shape
precipitation-related factors • Precipitable water (total atmospheric water vapor contained in a vertical column, mm) • Vertically-integrated moisture flux convergence (MFC): earlier work (Silva and Berbery, 2006) suggests model forecasts have better representation of MFC distribution than of precipitation • Also convective available potential energy (CAPE)
winter prec. water precipitation MFC • Mean prec. water generally similar to mean precipitation, but scale parameters (representing contribution of extremes) not strongly linked • MFC and precip. scale parameters have strong resemblance
summer prec. water precipitation MFC • Prec. water much larger in summer; distribution is close to Gaussian (shape > 20) over most of country • GPLLJ and NAM evident in both prec. water and MFC mean • MFC reflects both mean and extreme precipitation mean scale
ENSO modulation • 5 strongest El Niño winters and 5 strongest La Niña winters in 1979-2005 record using CPC’s Oceanic Niño Index El Niño 200 hPa zonal wind La Niña 200 hPa zonal wind
ENSO and winter precip. Areas with major changes in mean precip: southwest, Great Plains (Lower Missouri River basin), Ohio River basin, southeast Most of these areas show changes in extremes with same spatial extent and greater magnitude Increased wet-day frequency during El Niño in southwest Shape of distribution is less sensitive to changes in climate
ENSO: prec. water and MFC prec. water precipitation MFC Mean pr. water: little change with ENSO MFC changes are similar to precipitation; same areas, lesser magnitude
summary & conclusions • During winter, mean precipitation over most of the U.S. is dominated by contribution of heavy and extreme daily events • Throughout the year, areas of the country with more variable and extreme rainfall have strong daily MFC • Precipitation frequency distribution not strongly linked to prec. water distribution • Most areas with large change in mean precipitation between ENSO phases have greater change in extremes • ENSO-related change in MFC distribution similar to precipitation
references • Becker, E.J., E.H. Berbery, and R.W. Higgins, 2008: The frequency distribution of daily precipitation over the United States. J. Climate, submitted • Higgins, R.W., V. Silva, J. Larson, and W. Shi, 2007. Relationships between climate variability and fluctuations in daily precipitation over the United States. J. Climate, 15, 3561-3579. • Husak, G.J., J. Michaelsen, and C. Funk, 2007. Use of the gamma distribution to represent monthly rainfall in Africa for drought monitoring applications. Int. J. Climatol., 27, 935-944.