Download

1 / 45
450 likes | 466 Vues
PEOPLE EVERYWHERE. Humans first appeared about 200000 years ago, in the Horn of Africa. We started spreading around Earth about 60000 years ago. The World population is still rising rapidly- by about 9000 people an hour at present. Population growth is the change in a population over time.

E N D
Humans first appeared about 200000 years ago, in the Horn of Africa. • We started spreading around Earth about 60000 years ago.
The World population is still rising rapidly- by about 9000 people an hour at present.
Population growth is the change in a population over time. Very rapid growth started around two hundred years ago, when the Industrial Revolution was taking hold.
More facts • From 1900 to 1950 the world’s population increases by more than 50 per cent in just 50 years. • The really rapid growth in the world’s population took place between 1950 and 2000= 250% increase • USE THE ABOVE FACTS AND ANNOTATE THE PREVIOUS DIAGRAM!
Why does the population rise so fast? • Because birth rates are higher than death rates. • The birth rate is the number of live births per thousand people in a year. • The death rate is the number of deaths per thousand people in a year. • When birth rate is higher than death rate there is natural increase of a population.
How do we find the natural increase? • Birth rate minus death rate, but expressed as a percentage. • If the birth rate is 20 per thousand and the death rate 3 per thousand, then the natural increase is 17 per thousand, or 1.7%
Natural increase varies around the world. Natural decrease in developed countries High natural increase in developing countries Annual population growth rate
Why is it difficult to know exactly how many people are alive right now? • It is impossible to count everyone in every country. You need to send out forms, which some people won’t want to fill in – for example if they are illegally, or hiding from someone. • In areas where a lot of people can’t read, you need to send out interviewers with forms. It may be impossible to reach people in isolated places. • By the time you have finished counting some more people will have been born and some will have died, so the cencus is out of date immediately.
Activity 1 • The human POPULATION grows each year because there are more BIRTHS than DEATHS.
Activity 2 • It shows the increase in the world’s population over time from 10000BC to the present day. The x axis shows the year and the y axis shows the population in billions. • The line rises very slowly at first – it is nearly flat – but starts to climb steeply around 1800 AD. It’s shaped a bit like the letter J.
Activity 3 • Hunter gatherers live by hunting animals and gathering wild fruit and seeds. • Only a small number of plants were suitable for people to eat and plants were seasonal so food wasn’t easy to come by. Hunter gatherers had to move around over a large area to get enough food. They were threatened by predators (e.g. tigers) or poisonous animals , such as snakes.
Activity 4 • Farming meant that people were able to grow food and rear animals. • This meant that people had more food and were able to live longer. Children had a better chance of survival. • It also allowed settlements to grow, fed by farms. The growth of settlements brought more people together so the birth rate began to rise.
Activity 5 • Bronze was an excellent material for making tools and weapons as it was harder and stronger than stone, wood and bone tools that had been in use. • Bronze tools allowed people to clear large areas of land for farming and settlements and provided tools for farming. This enabled them to grow more food and live longer. • Settlements brought more people together so the birth rate began to rise. • Axes also allowed them to chop timber for constructing buildings and shelters, which protected them from danger.
Activity 6 • The period from 1760 to 1840 when many new machines were invented and many factories were built. • The new factories brought huge numbers of workers into towns. So the population of the towns exploded, which meant the birth rate also exploded as couples met and settled down together. The wealth brought by the Industrial Revolution helped toimprove services, helped more children to survive and helped people to live longer.
Activity 7 • 1804 • It reached 2 billion in 1927, so it took 123 to go from 1 billion to 2 billion. • It was 3 billion to 1959 and 6 billion in 1999, so it took 40 years to go from 3 billion to 6 billion.
So where is everyone? Distribution describes the way in which people are spread out across the Earth’s surface. This distribution is uneven! What does this mean??? Look at figure page 20. People are concentrated in certain parts of the world making these place very crowded. At the same time. Other areas have relatively few people living there. They are said to be sparsely populated. Population density is the average number of people per square kilometre.
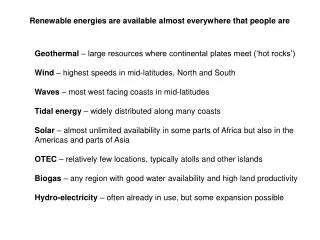
Reasons for the variations of population • On a global scale, the distribution of the population is mainly affected by physical factors such as relief, climate, vegetation, soils, natural resources and water supply. • For a given place there are usually several reasons for its dense or sparse population, e.g. Nile Valley and Sahara desert.
Population distribution in Egypt 1-Describe the distribution. 2- Suggest reasons for this distribution.
The distribution is uneven. (1) Some parts of Egypt, likealong the banks of River Nile and the river delta (Nile Valley) where Alexandria and Cairo are located, are very crowded (densely populated). (1) A big part of Egypt (Sahara Desert) though is lightly populated (sparsely populated). (1) Possible reasons for this distribution can be the better climate along the River Nile, where people can find fertile soil and can grow easily vegetation. (1) In addition, water supply and relief (ex. flat land) can be found near or in big cities (ex. Alexandria), the coast and the river valley rather than within the desert. (1)
2.2. So where is everyone?activities Pages 20-21
Activity 1 • Lot’s of people live there; it’s crowded. • Not many people live there; its fairly empty. • How people are spread or distributed around a country. • The number of people per square kilometre.
Asia and Europe a Examples may include India, Bangladesh, Japan, South Korea, Taiwan, UK, , Germany, Netherlands, Belgium. b Examples may include Greenland, Canada, Australia, Libya, Mongolia, Botswana, Namibia, Western Sahara, Mauritania.
Activity 4 a The climate is hot (close to the tropics) and very dry. There is no reliable rain there. c Very low population density People tend to settle where it’s easy to find water and grow food. And it’s bit too hot at P for people too!
Look at the following picture! • Using a few sentences, work with your partner and in the next 5 minutes answer the following questions! • What is the picture about? • Which country is it for? • Do you know anything else about it? (How is it connected with population growth?)
Answers • What is the picture about? • It is about the one-child policy. • Which country is it for? • China • Do you know anything else about it? (How is it connected with population growth?) • The government of China wanted to limit the rapid population growth (2.4%) in some areas of China.
Earth’s population in 2010: • At start of the year: 6809 million • At end of the year: 6890 million • Increase: 81 million • So growth rage: 1.2%
Key points! • Overall, Earth’s population is growing at about 1.2% (about 80 million people) a year! • However, population growth rates vary greatly between countries. • Population growth is generally faster in poorer, less developed countries, and slower in richer countries. • Population is rising fastest in Africa. • Population is falling in some countries.
Why are growth rates so high in some places? • People think of children as a form of security! • Many women have no access to advice about spacing out their children. They may have babies one after another! • Many girls have little choice. They are married very young and they are in control of their husbands!
The case study of Japan! • Japan has a NEGATIVE natural increase (with a population growth rate of - 0.13%) • It has a very low birth rate of 8.07 births per thousand and a higher death rate (due to its large elderly population) of 9.38 deaths per thousand! • Japan, which is a rich, more-developed country, has a high life expectancy (85 years)!
The case study of Uganda! • Uganda has a population growth rate of 3.24%. • This is due to an extremely high birth rate of 44.17 births per thousand, compared to a death rate of 10.97. • However, Uganda, which is a poor, less-developed country, has a very low life expectancy (54 years)!
The case study of China! • It is the most populous country, with over 1350 million people. It is not so wealthy • But it has a low population growth rate: about 0.5%! • 50 years ago, the population was growing at about 2.4%. But in 1979 the government introduced a new law! • The one-child policy! • China still gains nearly 7 million people every year!
The one-child policy! • China's one child policy was established by Chinese leader Deng Xiaoping in 1979 to limit communist China's population growth. • The policy limits couples to one child. Fines, pressures to abort a pregnancy, and even forced sterilization accompanied second or subsequent pregnancies. • It is not an all-encompassing rule because it has always been restricted to ethnic Han Chinese living in urban areas. Citizens living in rural areas and minorities living in China are not subject to the law. • However, the rule has been estimated to have reduced population growth in the country of 1.3 billion by as much as 300 million people over its first twenty years.
Reasons for low-life expectancy: • Famine (Not enough food/Poverty) • Governments too poor to spend (Not enough doctors to help) • Corrupt government officials (funds/help does not reach people in need) • Low level of education (generally more education = higher awareness of personal hygiene) • Availability of clean water (People often drink dirty water) • Widespread of diseases, such as AIDS (poor sanitation and low levels of vaccination) • Warfare • Air, water and environmental pollution
Activities page 25 • a) Any three from: Mali, Niger, Chad, South Sudan, Eritrea, Oman, Tanzania, Zambia, Zimbabwe, Angola. b) Any three from: Spain, Portugal, Ukraine, Romania, Bulgaria, Latvia, Lithuania, Hungary, Greece, Croatia, Japan, Greenland (Denmark) • Fifty years ago, China’s population was growing at about 2.4%. By allowing couples to have only one child, China reduced the country’s birth rate and slowed down the population growth rate.
Activity 4 More developed countries have access to more food, clean drinking water and health care, such as drugs and vaccinations against disease. People are better educated and able to make healthy lifestyle choices, e.g. about diet and exercise.
Activity 5 a) Africa b) Any two from: Mali, Niger, Nigeria, Democratic Republic of Congo, Angola, Zambia, Zimbabwe, Mozambique c) Any two from: United States of America, Canada, Mexico, Chile, Argentina, Australia, United Kingdom, Germany, France, Italy, Japan, South Korea. • Activity 6 Any four from: Mali, Niger, Chad, Angola, Zambia, Zimbabwe.