Download
1 / 36
360 likes | 515 Vues
the landscape through a soil scientist’s eyes... . Advance slide . Agricultural Land Rating Systems. for the Non-Soil Scientist. Earl Yamamoto, State Department of Agriculture February 5, 2000. Advance slide . Presentation Overview of major rating systems Comparison of systems

E N D
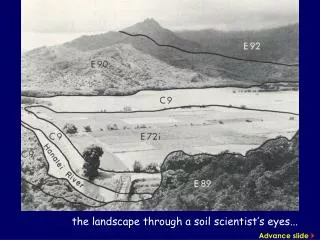
the landscape through a soil scientist’s eyes... Advance slide
Agricultural Land Rating Systems... for the Non-Soil Scientist Earl Yamamoto, State Department of Agriculture February 5, 2000 Advance slide
Presentation Overview of major rating systems Comparison of systems What approach? OVERVIEW Advance slide
Four major systems Land Capability Classification,USDA Overall Productivity Rating,Land Study Bureau, UH Agricultural Lands of Importance to the State of Hawaii (ALISH), DOA/USDA/CTAHR Land Evaluation & Site Assessment (LESA) System, LESA Commission OVERVIEW Advance slide
Land Capability ClassificationUSDA1972 Description Statewide USDA & UH soil surveys Soil data used by all systems Agricultural suitability as limited by soil & climatic conditions System favors mainland field crop & mechanization 8 Classes I-VIII, best to worse Effective cutoff=LCC Class IV Productivity estimated only for limited crops Sugar, pine, pasture, woodland Soils mapped statewide Advance slide
Land Capability ClassificationUSDA1972 Acreage in Agricultural District LCC I, II & III statewide: 381,609 acres (estimate) Percent LCC I, II & III: 20.6% of ag district Advance slide
Overall Productivity Ratings,Detailed Land ClassificationLSB, UH1965-1972 Description Developed concurrent with USDA soil survey Soils grouped into land types based on soil & productive capabilities Two sets of productivity ratings: Overall Productivity Rating-“A”, very good to “E”, not suitable Crop Productivity ratings forPine, sugar, vegetables, forage, grazing, orchard, timber Soil types drawn over aerial photos (variable scales) Advance slide
Overall Productivity Ratings,Detailed Land ClassificationLSB, UH1965-1972 Acreage in Agricultural District LSB A-C statewide: 447,250 acres (estimate) Percent LSB A-C: 24% of ag district Advance slide
ALISHDOA/USDA, UH/CTAHR 1977-78 Description Part of national effort (USDA) to inventory important farmlands National criteria applied, adapted by USDA, CTAHR & DOA Adopted by State Board of Agriculture, 1977 Broad range of factors considered Soils, climate, moisture supply, input use, etc., Production-related factors generalized Advance slide
ALISHDOA/USDA, UH/CTAHR 1977-78 Description 3 classes ofimportant agricultural lands Prime Soils with best physical, chemical, & climatic properties for mechanized field crops Excludes built-up land/urban, water bodies Unique Land other than prime for unique high-value crops--coffee, taro, watercress, etc. Other important agricultural lands State or local important lands for production, not prime or unique; needing irrigation or requiring commercial production management Advance slide
ALISHDOA/USDA, UH/CTAHR 1977-78 • Acreage in Agricultural District • ALISH statewide: 846,363 acres (estimate) • Percent ALISH: 45.8% of ag district Advance slide
LESALESA Commission1983-86 Description 1983 State Land Evaluation & Site Assessment Commission(Act 273, Session Laws, 1983) Standards & criteria for identifying important agricultural lands Inventory of important agricultural land LESA system Numeric scoring system USDA system to determine impact of federal activity on farmland Used to identify lands or evaluate individual sites Advance slide
Description Three components Agricultural production goals Land evaluation (LE) Soils, topography, climate Site assessment (SA) Non-physical properties (location, land use) LESALESA Commission1983-86 Advance slide
Description Ag production goalsfor crop acreage requirements Amount of land required to attain ag production objectives Estimates based on current & expected levels of production, population & per capita consumption Typical crops profiled: Sugar, pine, mac nuts, coffee, local dairy, eggs/poultry Crop acreage used to set cutoff score for LESA IAL lands LESALESA Commission1983-86 Advance slide
Description Land Evaluation (LE) Combines 5 soil ratings into single score for land capability LCC ALISH LSB Modified Storie Index Soil Potential Index LE score is weighted average LESALESA Commission1983-86 Advance slide
Description Site Assessment (SA) Based on USDA LESA manual, selected locational, environmental, operational factors 10 site factors;categories of factors: Farm productivity/profitability Land use potential/conflicting uses Conformance with government programs/policies Soils rated for each criterion, weighted, summed Final LESA rating=(LE rating+SA score) divided by 2 Threshold score for LESA IAL based on projected acreage Mapping & GIS coverage limited LESALESA Commission1983-86 Advance slide
LESALESA Commission1983-86 • Acreage in Agricultural District • LESA IAL statewide: 759,534 acres (estimate) • Percent LESA IAL: 41.1% of ag district Advance slide
Comparison of Systems Common features Soils-based with factors for topography, climate Vary in consideration of other attributes like crop yield Limitations to agricultural productivity considered in some form Mostly physical and climatic limitations All are available on State GIS in some form Advance slide
Comparison of Systems Major differences Soils-based systems exclude other factors related to ag profitability Determination of ag land requirements LESA system unique in its use of agricultural production goals Other systems do not predetermine land requirements Incorporation of land use policy considerations LESA includes policy criteria Land use policy dealt with in other systems only by the exclusion of urbanized, built-up, subdivided land Advance slide
Amount of land rated suitable for agriculture LEAST LCC 21% of ag district LSB 24% LESA 41% ALISH 46% MOST Comparisonof Systems Advance slide
Comparison of systems • LCC -- Lands better than Class IV ALISH 8“Prime” & “Other Important Ag” LCC ALISH • LSB -- “A”-“C” lands LESA 8Lands above threshold IAL score LSB LESA Advance slide
Comparison of Systems Evaluation criteria(based on CTAHR, 1990) Ease of use Low cost, clear explanations, factors well-defined Objectivity Measurable factors with quantifiable data Consistency Scores would be same across individuals, clear definitions, interpretations consistent, no incentive for score manipulation Adaptability Can be readily updated to reflect change GIS-readiness Advance slide
Comparison of Systems Ease of Use Easiest LCCStraightforward use of soils data ALISH LSBCrop indices & inputs would need to be reassessed; more cost to State Difficult LESAMost complex, scoring system is opaque, mapping problems; most costly to define & use Advance slide
Comparison of Systems • Objectivity • Most objective • LCC • LSBCriteria clear/quantifiable for both • Less objective • ALISHNo standardized way to define “unique” • Least • LESAFactors not clear, difficult to quantify & map Advance slide
Comparison of Systems • Consistency • Most consistent • LCC • LSBProperties, criteria clear • Less so • ALISHBoth “unique” & “other” introduce variability • Least • LESAVariability in interpreting, assigning values/weights to factors Advance slide
Comparison of Systems • Adaptability • Most adaptable • ALISH Criteria can be reapplied, accommodates unique crops • Less so • LCCCriteria constant, least sensitive to local crop potential • LSBDated, system indexed to sugar & pine & farm practices at time • Least • LESAComponents outdated; indexed to sugar & pine; productivity goals rigid; most difficult to update Advance slide
Comparison of Systems • GIS-readiness • Most GIS-ready • LCCUSDA NRCS maintains GIS soils data, source of State GIS data • ALISHOn State GIS, USDA soils data for update available • Less so • LSBOn State GIS, data old • Least GIS-ready • LESAData on State GIS of questionable value/need to redigitize; problems encountered in mapping factors Advance slide
Closing Thoughts Summary 1. Each of the systems has limitations in application--none ideal 2. Ratings change with change in conditions or opportunities Some examples... Advance slide
Closing Thoughts Example of how one factor--irrigation--changes ratings Under LCC system, good ag lands WITHOUT irrigation Advance slide
Example of how one factor--irrigation--changes ratings Closing Thoughts ... withoutirrigation ... good ag lands WITH irrigation Advance slide
ALISH LSB • Two views of Lanai pineapple under different rating systems--LSB “D” vs. ALISH “Unique” Closing Thoughts “C” “Unique” “D” Advance slide
LSB • Two views of Hanalei Valley taro under different rating systems--LSB “E” vs. ALISH “Unique” Closing Thoughts ALISH “unique” Advance slide
Closing Thoughts 3. All need to be updated to reflect present conditions--some more than others 4. In general, system is more robust if: Emphasis is on resource suitability System criteria are well-defined • Summary 1. Each of the systems has limitations in application--none ideal 2. Ratings change with change in conditions or opportunities Advance slide
Closing Thoughts In considering a system... Purpose of ratings:identify resource,system will be soils-based Factors of land use policy more appropriate for public decision making process,creates problems if built into rating system Must weigh value of additional time/money spent on development & maintenance of system Advance slide
Credits Department of Agriculture James Nakatani, Director Earl Yamamoto State Office of Planning, DBEDT David Blane, Director Ruby Edwards Chris Chung Dennis Kim, State GIS Program