Download
1 / 16
160 likes | 314 Vues
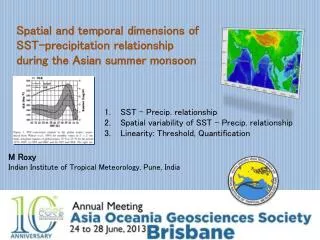
M Roxy Indian Institute of Tropical Meteorology, Pune, India. Spatial and temporal dimensions of SST-precipitation relationship during the Asian summer monsoon. SST - Precip . relationship Spatial variability of SST - Precip . relationship Linearity: Threshold, Quantification. 2/16.

E N D
M Roxy Indian Institute of Tropical Meteorology, Pune, India Spatial and temporal dimensions of SST-precipitation relationship during the Asian summer monsoon • SST - Precip. relationship • Spatial variability of SST - Precip. relationship • Linearity: Threshold, Quantification
2/16 SST-precipitation relationship over tropics - the upper threshold and CAPE Gadgil, S., Joshi, N. V. & Joseph, P. V. Ocean-atmosphere coupling over monsoon regions. Nature312, 141-143 (1984). • Upper threshold of 28.5 - 29.5℃ • Explanation given: • Precipitation tends to occur where positive convective available potential energy (CAPE) exists • -> the occurrence of deep convection will tend to squelch CAPE? Waliser, D. E., Graham, N. E. & Gautier, C. Comparison of the Highly Reflective Cloud and Outgoing Longwave Radiation Datasets for Use in Estimating Tropical Deep Convection. Journal of Climate6, 331-353 (1993).
3/16 SST-precipitation relationship over Indian Ocean - the upper threshold and CAPE Sabin, T., Babu, C. & Joseph, P. SST–convection relation over tropical oceans. International Journal of Climatology (2012).
4/16 SST-precipitation relationship over West Pacific - negative relationship at temperatures > 29℃? Rajendran, K., Nanjundiah, R. S., Gadgil, S. & Srinivasan, J. How good are the simulations of tropical SST–rainfall relationship by IPCC AR4 atmospheric and coupled models? J. Earth System Science, 1-16 (2012).
Data, Model and Methods 5/16 Satellite Data/Observations/Reanalysis • SST, Precipitation: TMI/TRMM • Air Temp, Sp. Humidity, Divergence: • ERA-Interim Reanalysis 1998-2011 (14 years) Model: NCEP CFSv2 • Atmosphere: NCEP Global Forecast System (GFS) • horizontal: spectral T126, ~90 km vertical: 64 sigma-pressure hybrid levels • Ocean: GFDL Modular Ocean Model v4 (MOM4p0)40 levels in the vertical, 0.25-0.5°horizontal. • Sea Ice: GFDL Sea Ice Simulator(SIS) an interactive, 2 layer sea-ice model • Land: NOAH, an interactive land surface model with 4 soil levels ~ 100 years simulation with mixing ratios of time varying forcing agents set for the current decade
6/16 SST-precipitation relationship over monsoon basins - SST mostly above the upper threshold So does the high SSTs over the monsoon basins play an active role on the Asian monsoon?
7/16 SST-precipitation relationship - brief history Intraseasonal SST influence the atmospheric variability, eg: Precipitation (Vecchi and Harrison 2002, Fu et al. 2008). OLR Index ISV of Bay of Bengal SST (TMI) VH 2002: Negative SST lead monsoon break by 10 days (r = 0.67). Step by step process on the SST- precipitation relationship?
Kemball-Cook & Wang, 2001 8/16 Latent heat flux (-ve upward) anomalies enhance precipitation by enhancing the moist static energy (Kemball-Cook and Wang 2001) (d) Precip. & SST (a) SAT & SST (b) ∆θe & SST (c) CLW & SST Mean monsoon winds are westerly ! Roxy & Tanimoto, 2007 positive SST anomalies => destabilize lower atmos. column => convective activity (Roxy and Tanimoto 2007) Convective Activity Convective Activity Easterly Wind Anomalies (reduced total winds) Easterly Wind Anomalies Atmosphere Atmosphere ∆θe anomaliesunstable conditions moist stat. anomalies Reduced Evaporation Increased Evaporation Increased SST Ocean Ocean
9/16 SST influence on the destabilization of lower atmospheric column: Virtual potential temperature (θv)over Arabian Sea during pre-active phase Atmospheric soundings between June 2-14 Holt and Raman, 1987. Mean profile of virtual potential temperature θv, for 0600 GMT on 2 June (pre-monsoon) and 11-14 June (onset) from MONEX 79 ship data over Arabian Sea. June June 11: pre-active phase Pressure Roxy and Tanimoto 2007 (a) θe1000 anomalies (b) θe700 anomalies θv (oC)
10/16 TMI Spatial variability of SST – Precipitation relationship response time difference of 1 week! The SST-precipitation relationship have different lead-lagsover the Arabian Sea and the Bay of Bengal/South China Sea 12 days 5 days Precip. lags SST daysPrecip. leads SST Ocean -> Atmosphere | Atmosphere -> Ocean The magnitude of the correlation refers to the intensity of the driving force, and the corresponding lag (lead) time denotes how quickly the atmosphere responds to the SST anomalies and vice versa.
11/16 Role of surface convergence on the response time Observations Model TMI Relatively stronger surface convergence over the Arabian Sea accelerates the uplift of the moist air, resulting in a relatively faster response in the local precipitation anomalies
12/16 SST – Precipitation relationship with/without lags In observations 1℃ rise in SST -> 2 mm/day in rainfall
13/16 SST – Precipitation relationship with/without lags In model simulations 1℃ rise in SST -> 2 mm/day in rainfall
14/16 Comparative roles of Eq. potential temperature and upper level divergence Large scale circulation features has a role in modulating the SST-precipitation relationship
15/16 SST – Precipitation relationship In a changing climate Increase in Monsoon Precipitation with increasing SST Regions of maximum precipitation tends to be located at the ascending branches of the tropical circulation (Lau et al. 1997) 1℃ rise in SST -> 2 mm/day in rainfall
16/16 Conclusion 1. SST – precipitation relation has a spatial variability over the monsoon basins, with a lag of: ~ 5 days over the Arabian Sea ~ 12 days over the Bay of Bengal and South China Sea 2. Considering this lag, a quantifiable relationship can be deduced between SST (above 26℃) and precipitation: 1℃ rise in SST -> 2 mm/day in rainfall 3. Relationship holds for a changing climate. Warming environment weakens the monsoon circulation BUT increasing SST balances the amount of precipitation