Download
1 / 35
350 likes | 618 Vues
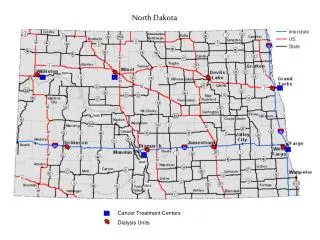
Crops and Crop Production in North Dakota. Joel Ransom. North Dakota Ag Overview ~90% of land mass is farmed. Basic agricultural statistics. Land in farms = 39,600,000 acres Number of farms = 31,910 Average farm size = 1,241 Crop dominates livestock related agriculture in most counties

E N D
Crops and Crop Production in North Dakota Joel Ransom
Basic agricultural statistics • Land in farms = 39,600,000 acres • Number of farms = 31,910 • Average farm size = 1,241 • Crop dominates livestock related agriculture in most counties • Few dairies remain in the state • Five ethanol plants consume ~40% of the corn produced in the state
Major crops produced • Spring wheat = 5.5 million acres • Soybeans = 4.6 million acres • Corn = 3.4 million acres • Durum = 1.4 million acres • Canola = 1.3 million acres • Barley = 1.1 million acres • Winter wheat = 750,000 acres • Sunflowers = 740,000 acres • Dry edible beans = 660,000 acres • Flax = 260,000 acres • Peas = 250,000 acres • Sugar beets = 220,000 acres • Lentil = 180,000 • Oats = 110,000 acres
2011 rank in the U.S. Commodity Percent of Nation’s production 1 Beans, dry edible, all 25% 1 Beans, navy 35% 1 Beans, pinto 46% 1 Canola 83% 1 Flaxseed 87% 1 Honey 22% 1 Sunflower, oil 40% 1 Wheat, Durum 36% 1 Wheat, spring 37% 2 Sunflower, all 38% 2 Sunflower, non-oil 24% 2 Wheat, all 10% 3 Barley 11% 3 Lentils 17% 3 Oats 8% 3 Peas, dry edible 21% 3 Sugarbeets 16% 4 Safflower 1% 6 Hay, alfalfa 6% 6 Potatoes 5% 9 Hay, all 4% 10 Soybeans 4% 12 Corn for grain 2% 17 Hay, other 2% 26 Wheat, winter 1%
Challenges of growing corn in ND • Drought – corn is a high water user • Short growing season • Getting corn dry enough to bin in the fall without drying is difficult because of low temperatures after maturity
Plant on or before 1 May Effect of planting date on yield, moisture and test wt, Carrington, ND, 2003
Minimize fall applications due to potential losses Rate = 1.0 to 1.2 x yield goal Apply bulk pre-plant or at planting Splits should be applied before tasseling Highest N demand V12 to VT N fertilization strategies
Effect of tile drainage and additive at the 112 N rate on yield of corn, NW22, 2011.
Northwest MN Planting Rate Studies Affect of Seeding Rate on HRS Yield. Seven Variety Average Wiersma. 1996-1998. Crookston, MInnesota Optimum plants = also about 35 per sq. ft
Relationship between protein and yield Northern locations 2009 - 2011: 20 environments
General recommendations with application of Post-anthesisNitrogen • After flowering is completed through watery-ripe seed stage (main stem head) • 30 lbs N/acre (10 gal UAN) provides an average increase of one-half percentage point of protein • Potential for significant leaf burning using UAN • dilute with water (e.g. 50:50) • apply evenings, early mornings, or cloudy days • Similar response among cultivars • No statistically-significant differences with response for grain yield, test weight and seed size
Protein increase with post anthesis UAN application (30 lb/acre N)
Tan spot the most common disease Early season tan spot Overwintering Fruiting Bodies on Wheat Straw
Bacterial Leaf Streak No control options, but there are differences among variety responses Good data in 2011, 1st complete set of ratings presented
Crop Sequence Effects in Phase II Experiment Units are percent increase or decrease in seed yield of expected crop caused by preceding residue crop. Residue (left side) and expected (top) crops are listed in order of increasing average water use.
Crop Sequence Effects in Phase III Experiment Units are percent increase or decrease in seed yield of expected crop caused by preceding residue crop. Residue (left side) and expected (top) crops are listed in order of increasing average water use.
Conclusions • ND is a key agricultural state • Land is mostly devoted to agriculture • Cropping is more important than animal production • ND leads in production of many commodities • Diversity of crops provides interesting challenges and opportunities • Short growing season and uncertainly of rainfall (western) are the main constraints