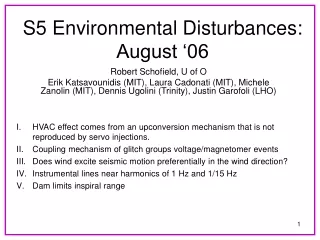
Environmental Coupling During S5
Environmental Coupling During S5. I. PEM injection overview Acoustic/seismic coupling Seismic upconversion Magnetic coupling RF coupling S5 environmental coupling epochs High frequency PEM injections Cost of suggested sensors for Hi-f. Robert Schofield (University of Oregon ).


Environmental Coupling During S5
E N D
Presentation Transcript
Environmental Coupling During S5 I. PEM injection overview Acoustic/seismic coupling Seismic upconversion Magnetic coupling RF coupling S5 environmental coupling epochs High frequency PEM injections Cost of suggested sensors for Hi-f Robert Schofield (University of Oregon)
S5 PEM Injections LHO LLO Round 1: Nov.-Dec. 2005 Dec. 2005 Round 2: April-May 2006 Aug. 2006 Round 3: October 2007 Oct. 2007 acoustic seismic acoustic / seismic seismic upconversion magnetic RF broadcast from here
S5 PEM Injections: sample coupling functions Acoustic Magnetic
Limitations and successes of environmental coupling factors • Limitations: • Environmental source is closer to coupling site than to any sensor/no sensor near coupling site. • Non-linear coupling • Broken sensor channel • Change in coupling • Successes: • Correctly predicted size of power grid events in DARM. • Correctly predicted variation in 60 Hz H1 DARM peak with current in high-tension lines 2km from LHO. • Correctly predicted size of magnetic features in DARM from rack magnetic fields, and other local sources. • Correctly predicted size of many acoustic features in DARM from things such as PSL chillers. • Correctly predicted the size of the famous airplane signal in DARM.
Main S5 LHO in-band acoustic/seismic coupling sites Optical lever regions H0:PEM-OUT_PWR1 (ITMY) and H0:PEM-LVEA_PWR1 (ITMX) Dark ports (ISCT4 & 10) Laser tables (PSL1 & PSL2)
H1 acoustic coupling function variation-this is the scale of variation that might not have been noticed April ‘06 before acoustic tuning of beam position on AS diodes Nov. ‘05 April ‘06, after tuning
Reduction in H1 acoustic coupling from commissioning: “floating” of dark port Before floating Red (H1) reduced toblue (H2)level or below After floating
New acoustic coupling in LLO LVEA electronics bay Red: LVEA_MIC, DARM Coherence Blue: BAYMIC, DARM coherence
Summary of S5 acoustic coupling • H1 & H2: • Sound has to be 10-100 times louder than ambient sound background to appear in DARM, generally. • Warning: there may be unknown periods of increased coupling. • Main coupling sites (H1&H2): AS ports, ITM optical lever regions, PSLs. Sites are roughly equal. Thus acoustic coupling will not decrease much for AS diodes in vacuum. • Important new ITM optical lever accelerometer channels, H0:PEM-OUT_PWR1 (H1 & H2 ITMY) and H0:PEM-LVEA_PWR1 (H1 & H2 ITMX). • LVEA_MIC is the only sensor that reaches above 900 Hz. Ambient sound at 1200 Hz is predicted to produce displacement noise ~100 below DARM.
Summary of S5 acoustic coupling • L1: • Similar to H1&H2: displacement noise from ambient sound level is 10 to 100 below DARM for the LVEA, end stations even lower. • Acoustic coupling was detected in an electronics bay (LVEA) for the first time at the end of the run. Coupling level comparable to LVEA coupling. • More sensitive to loud noises than H1&H2 - looses lock. As best as I could determine, the ITM optical lever regions are the worst coupling sites below a couple of hundred Hz.
Anomalous seismic upconversion at LHO EY EY, Oct., 08 PEM injections EY had previously been with other stations
Summary of S5 low-f seismic coupling producing upconversion • H1 & H2: • Close to the same at all four outstations (H1 & H2) for most of the run. • At EY (H1), changed late in run.
Main S5 LHO (and likely LLO) magnetic coupling sites Below 200 Hz: test mass magnets Above 200 Hz: ISC electronics
H1 magnetic transfer functions Below 200 Hz from test mass magnets, above 200 Hz from coupling to ISC electronics H1
S5 features in DARM from rack magnetic fields H1 Coherence between DARM and magnetometer placed in rack Magnetic field in rack DARM with feature amplitude consistent with prediction from injections
Magnetic field in racks was close to limiting H1 range. Rack magnetometers for S6? H1 Predicted broad-band displacement noise from rack magnetic fields reaches within 2 of DARM floor
Magnetometer-DARM coupling factors are similar between sites LHO LLO
LLO crab-killing X-arm magnetic transients Magnetometers, LVEA, EX, EY Thick: during transient Thin: between transients DARM - magnetometer coherence from repeated transients. No coherence with EY
Summary of S5 magnetic coupling • H1 & H2 : • Very little variation below 200 Hz (less than factor of 2)seen during run. • Below 200 Hz the main coupling sites are the test mass magnets. • Above 200 Hz, the strongest coupling sites are in the region of the AS demod boards, followed by the optic controllers. • Some features in DARM are from magnetic fields inside the electronics racks. • The coupling at the auxiliary channel demod boards appears to be nearly as bad as AS boards at low frequencies, so we might want to try some mitigation for eLIGO. • Magnetometer at EY was mis-oriented between Sept. 4, 2007 and Oct 21, 2007. • The 60 Hz peak in H1 & H2 DARM at level expected from magnetic coupling. • 3 Hz sidebands of 60 Hz throughout run from the PSL chillers.
Summary of S5 magnetic coupling • L1: • Coupling factors varied by less than 2 over the run. • Coupling is within a factor of 4 of LHO. • The 60 Hz peak in DARM is at a level expected from magnetic coupling of ambient fields. • One set of 1 Hz side bands of 60 Hz was eliminated when remaining duct heater was turned off. A smaller set of 1 Hz sidebands are from the X&Y-arm TCS chillers, mainly X. From pulsed heat. • Crab pulsar sensitivity is reduced by magnetic transients that appear simultaneously at the LVEA and EX, but not at EY.
Why radios are important veto channels RF PEM injections show up in DARM External sources, almost as loud as PEM injections, within a couple of MHz of 25 MHz (possibly Automatic Link Establishment)
Summary of S5 RF coupling • H1 & H2 • Constant throughout S5 • A peak in the radio channel needs to be a factor of about 100 above background before it shows up in DARM. L1 • Constant throughout S5 • A peak in the radio channel needs to be a factor of about 100 above background before it shows up in DARM. • Automatic Link Establishment signals may show up on DARM.
Environmental coupling epochs during S5Bad sensor epochs not included, but new channels are. H1 LVEA acoustic/seismic: Nov. 1 2005 - Apr. 14, 2006 Photo diode damage caused factor of 5 coupling variation in this period. Especially affects ISCT4_MIC and ISCT4_ACCX,Y,Z. Apr. 14, 2006 - July 11 2006Good running before addition of new channels. July 11 2006 - Nov. 16, 2006 New channels at ITM optical levers (H0:PEM-OUT_PWR1 (ITMY) and H0:PEM-LVEA_PWR1 (ITMX)) Nov. 16 2006 - July 13 2007 ISCT4 floating reduced acoustic coupling in 300 and 700 Hz region by ~5, and reduced coupling of floor vibrations by about 10. Especially affects ISCT4_MIC and ISCT4_ACCX,Y,Z. July 13 2007 - end of run Accelerometer added to HAM5 (H0:GDS-TEST_32_1_12) LVEA RF: Nov. 1 2005 - Jun. 11, 2006 Jun. 11, 2006 - end of runH1 radio channel added H0:PEM-RADIO_LVEA_H1
Environmental coupling epochs during S5Bad sensor epochs not included, but new sensors are. H1(continued) End stations acoustic/seismic: Nov. 1 2005 - Feb. 14, 2006 Feb. 14 2006 - end Coupling down by factor of 5 after transmitted port work. Especially affects BSC10_MIC, ACC and BSC9_MIC, ACC ?-end Seismic upconversion increase by >10 at EY. Affects EY_SEISX,Y,Z and DARM. H2 LVEA acoustic/seismic: Nov. 1 2005 - July 11, 2006 July 11 2006 - July 13, 2007New channels at ITM optical levers (H0:PEM-OUT_PWR1 (ITMY) and H0:PEM-LVEA_PWR1 (ITMX)) July 13 2007 - July 18 2007 Accelerometer added to HAM5 (H0:GDS-TEST_32_1_12) July 18 2007 - Aug. 15, 2007 Period of bad ISCT10 alignment. Especially affects ISCT10_MIC and ISCT10_ACCX,Y,Z. Aug. 15 2007 - end Mid stations acoustic/seismic: Beginning - end
Environmental coupling epochs during S5bad sensor epochs not included L1 LVEA acoustic/seismic: Beginning - April 28 2006 Before ISCT4 was isolated with rubber. April 28 2006 - Aug. 22 2006 After ISCT4 on rubber. Especially affects ISCT4_MIC & _ACCX,Y,Z Aug. 22 2006 - end Period of possible electronics bay coupling. LVEA_BAYMIC important. LVEA magnetic: Beginning - Aug. 22, 2006 Duct heater on, less sensitivity around 60 Hz Aug. 22, 2006 - end Duct heater off. Affects LVEA_MAGX,Y,Z. End stations acoustic/seismic and magnetic: Beginning-end
New sensors added during S5 • H0:PEM-OUT_PWR1 (H1 and H2 ITMY optical lever accelerometers) July 11, 06 • H0:PEM-LVEA_PWR1 (H1 and H2 ITMX optical lever accelerometers) July 11, 06 • H0:GDS-TEST_32_1_12 accelerometer on HAM5-OMC flange July 13, 07 • H0:PEM-RADIO_LVEA_H1, Jun. 11, 06
HI-f magnetic coupling: rack magnetic peak in fast AS_Q at predicted level Peak in Hi-f AS_Q from magnetic field in rack Peak in rack magnetometer
High frequency PEM injection summary • Certain peaks in Hi-f AS_Q are produced by ambient magnetic fields • Broad band magnetic noise was observed that should produce noise at up to 1/4 of the GW channel background. • Ambient RF fields were observed that could produce noise above background in the GW channel, if they drifted into band. • In contrast, ambient sound is expected to produce a noise floor that is several orders of magnitude below the hi-f GW channel floor.
What sensors would we want to have for Hi-f channel • Magnetometers: 33 single axis (9 LHO LVEA, 6 LLO LVEA, 3 at each outstation), $330,000, or make them • Microphones: (2 LVEA, 1 each outstation), $20,000 • Radio receivers: 1 each site, no extra cost • Channels: 44 (mostly 2048)